
Understanding the Analytics Overview Dashboard
Learn how to read the main analytics dashboard, including key metrics like conversations, messages, articles, and overall performance trends.
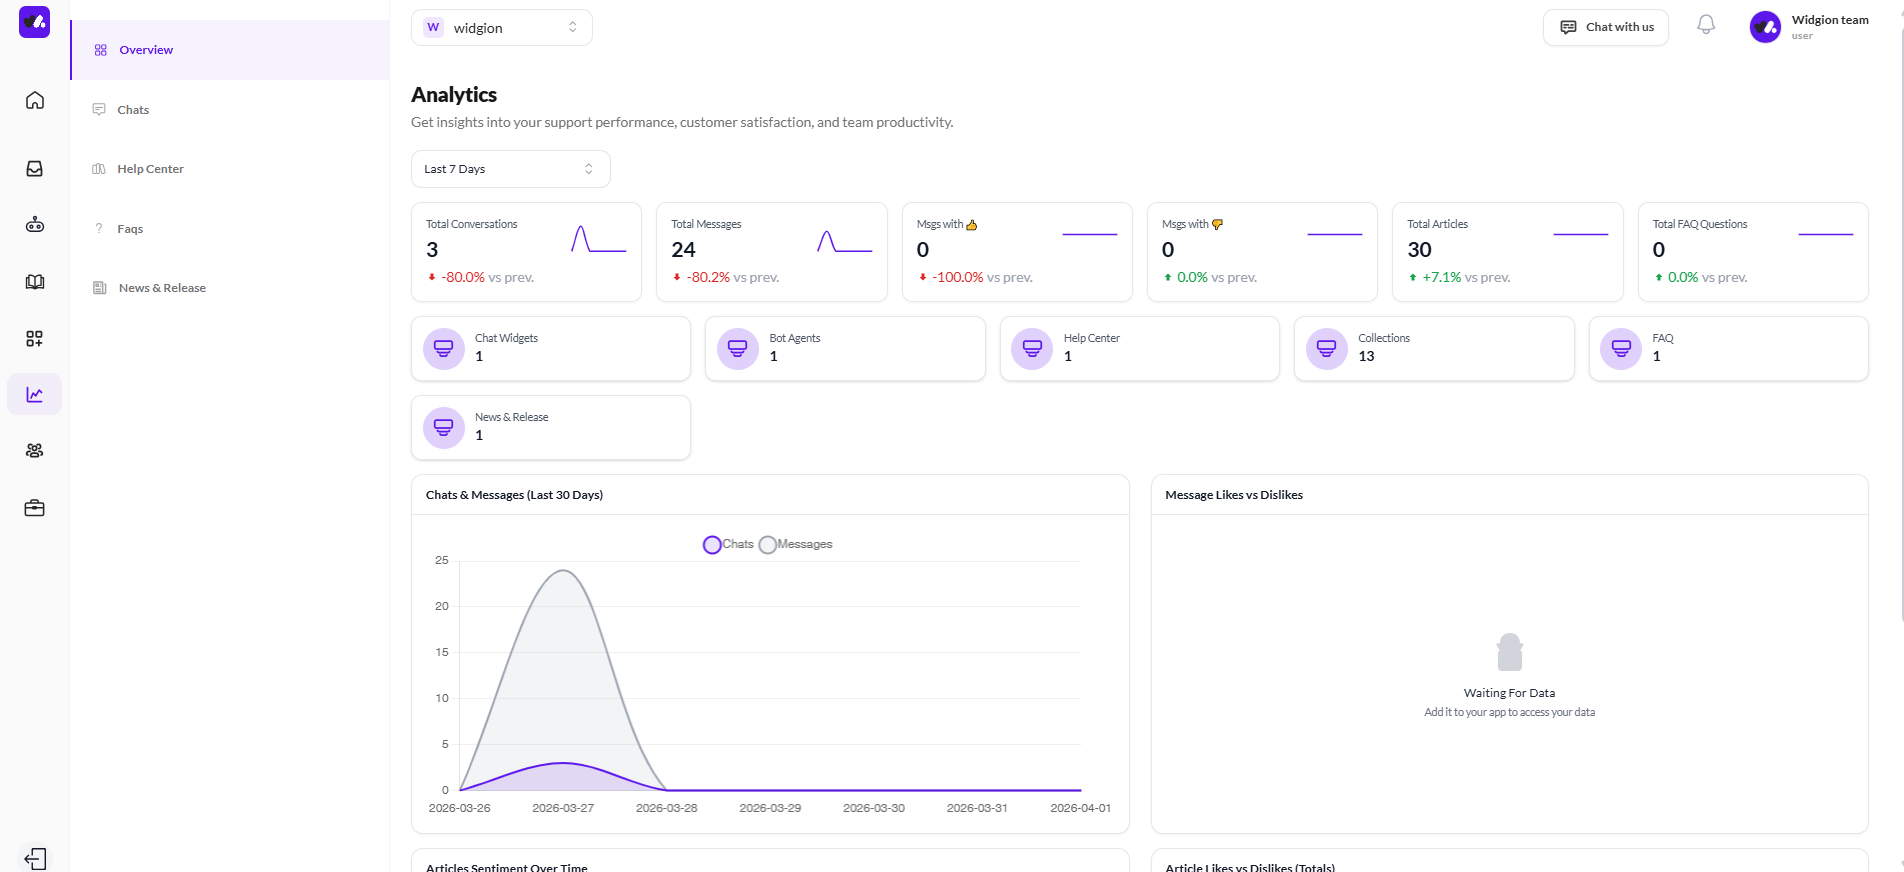
The Analytics dashboard gives you a high-level view of how your support operation is performing. From total conversations to message trends and content stats, everything you need to assess your widget's impact is available in one place. To access it, click Analytics in the left sidebar and select Overview.
Setting Your Date Range
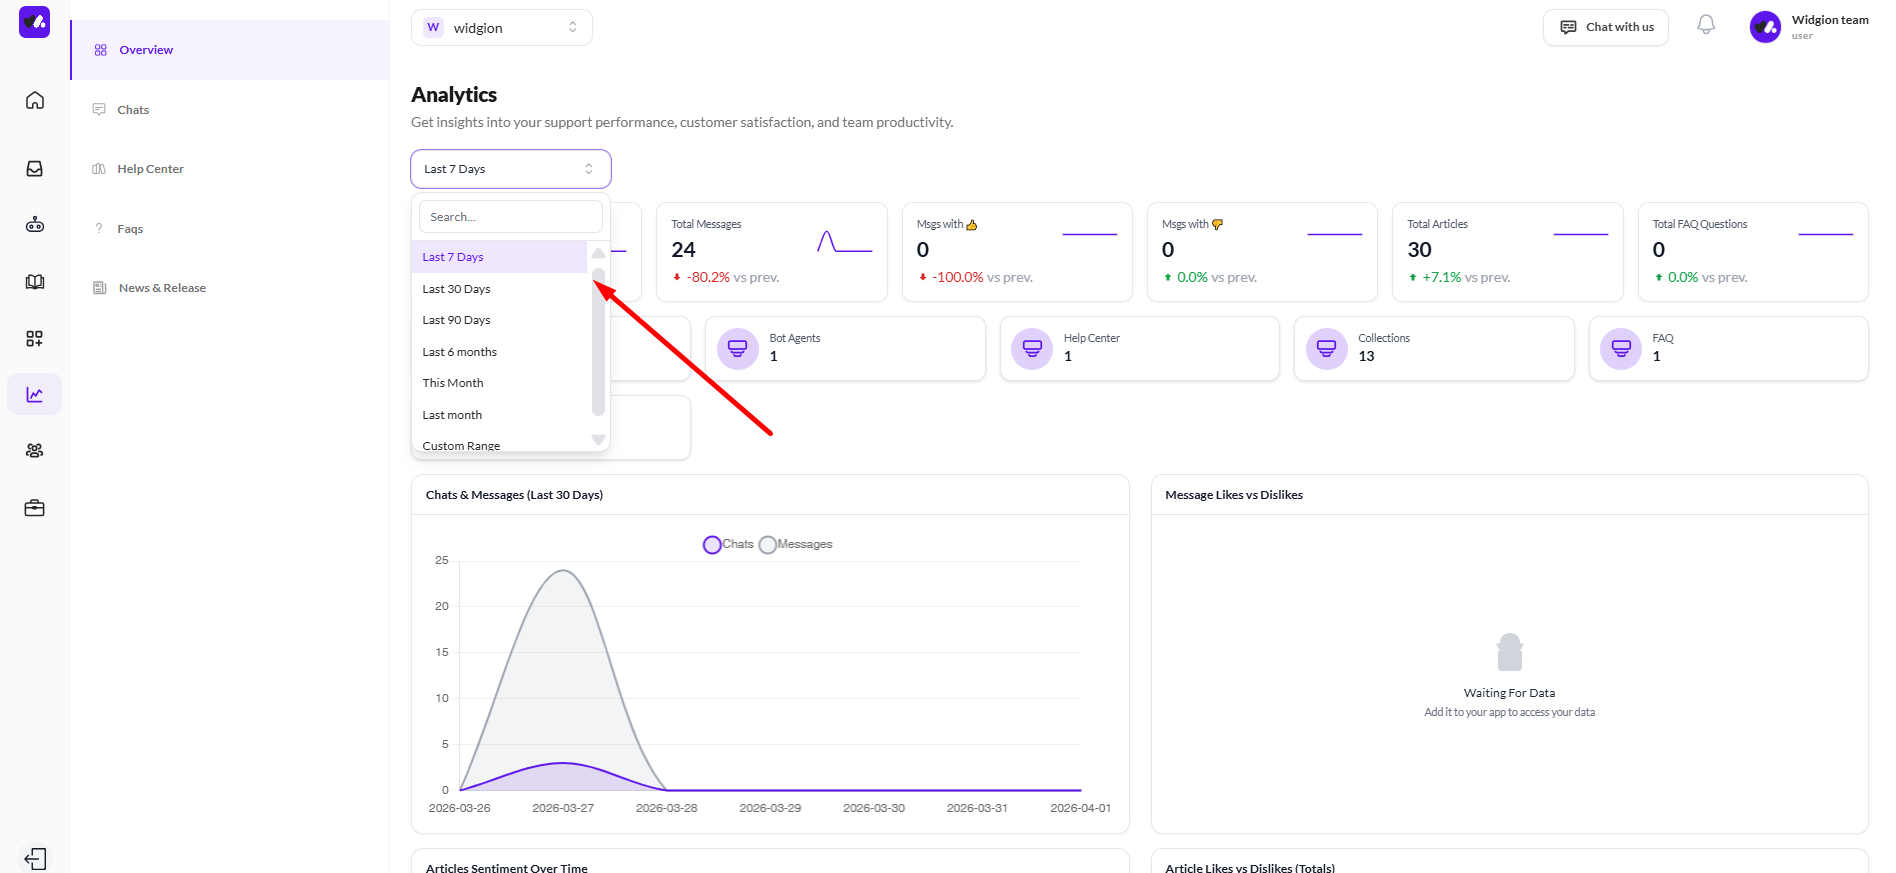
At the top of the dashboard, you'll find a date range selector currently set to Last 7 Days by default. Click it to adjust the time period you want to analyze. All the metrics and charts on the page will update based on the range you select.
Key Metrics at a Glance
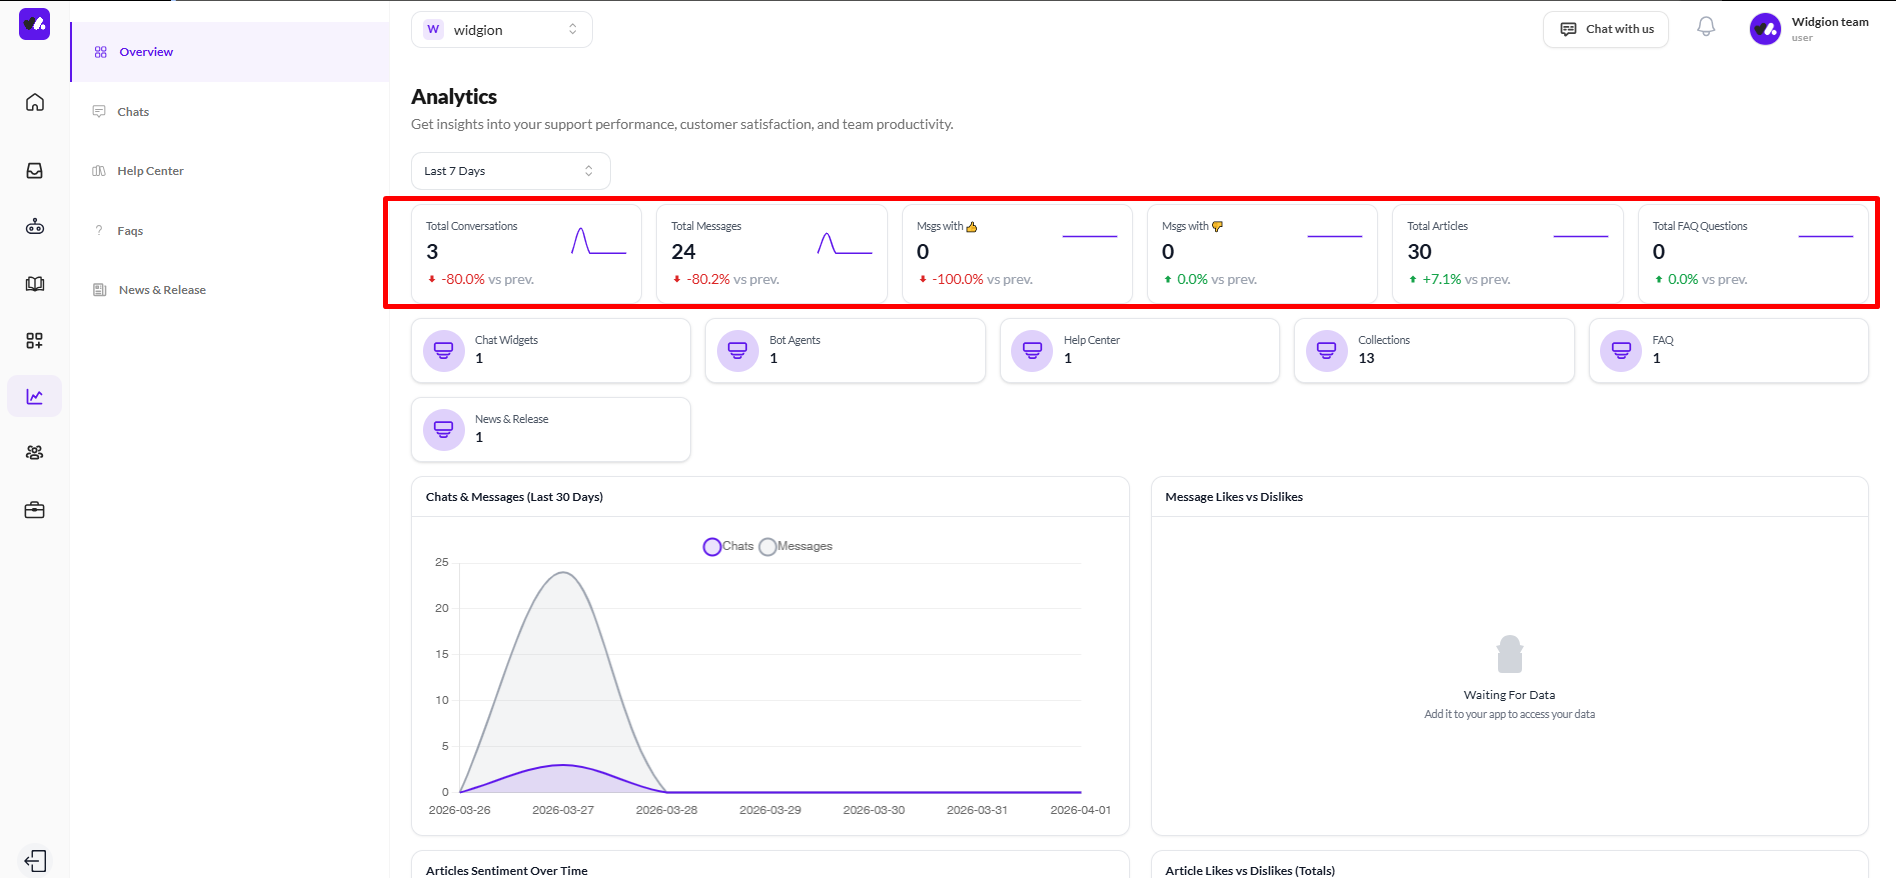
Across the top of the dashboard, six summary cards give you an instant snapshot of your performance. Each card shows the current figure alongside a percentage change compared to the previous period, so you can quickly tell whether things are improving or declining.
The metrics displayed are Total Conversations, Total Messages, Messages with a thumbs up, Messages with a thumbs down, Total Articles, and Total FAQ Questions.
Platform Summary Cards
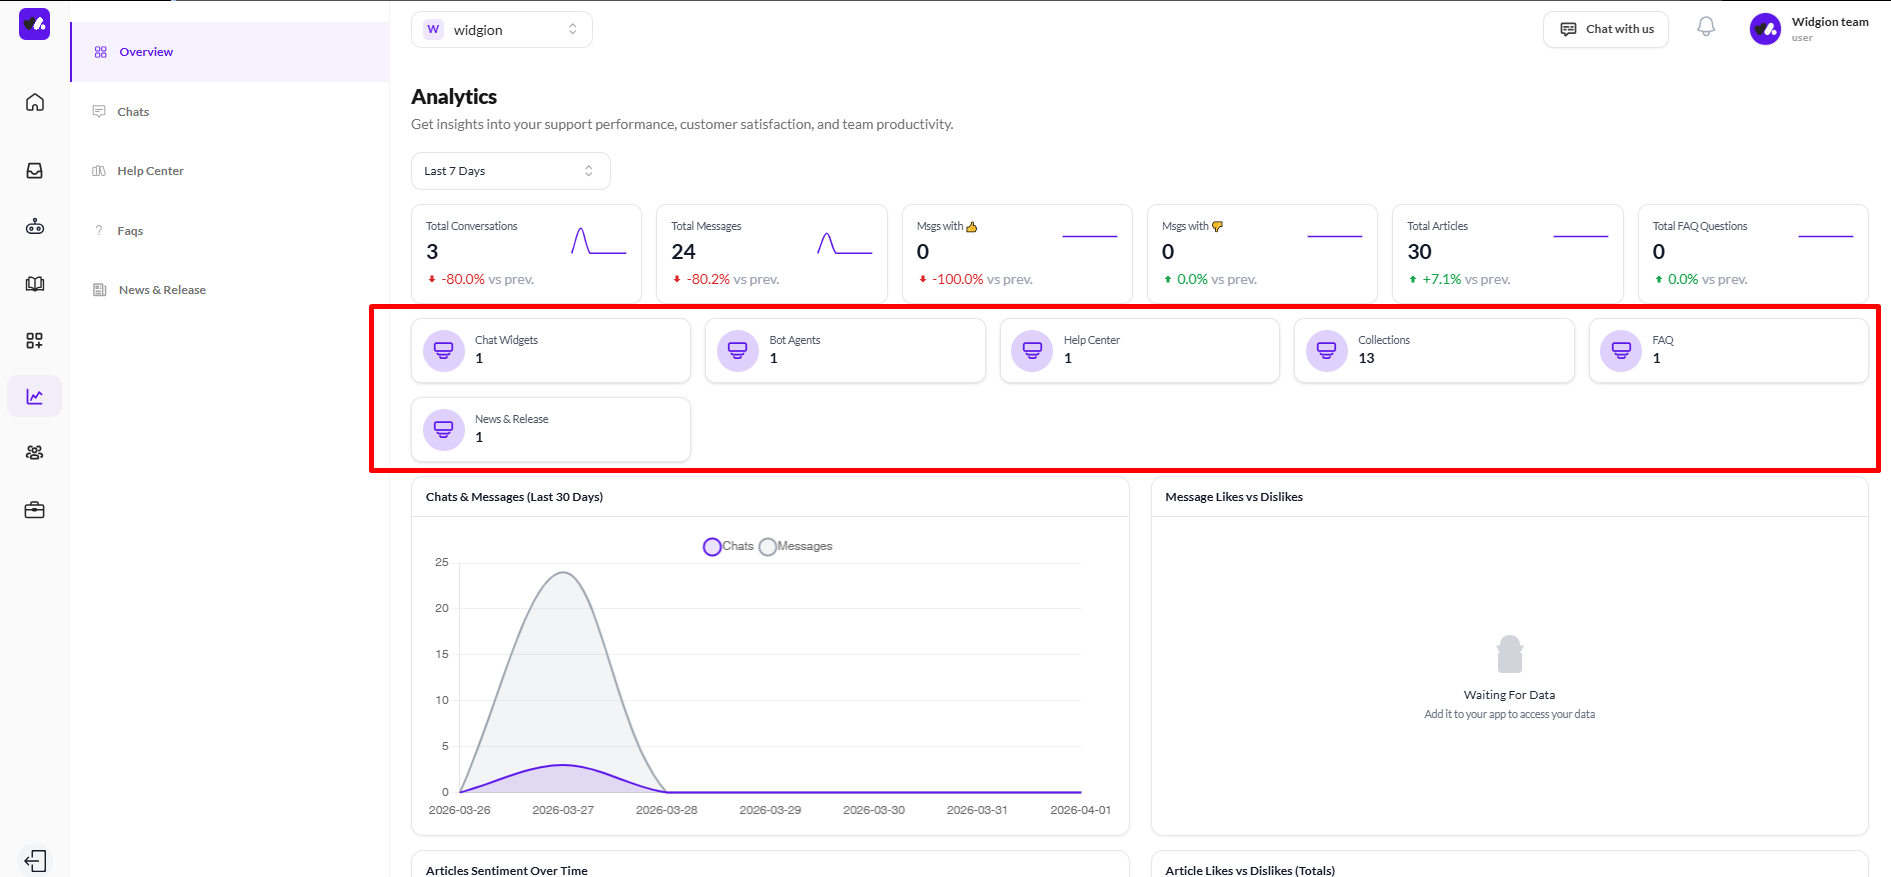
Below the metric cards, a second row of summary tiles shows a count of your active assets across the platform. These include Chat Widgets, Bot Agents, Help Center, and Collections, giving you a quick reference for how much content and how many active components are currently running under your account.
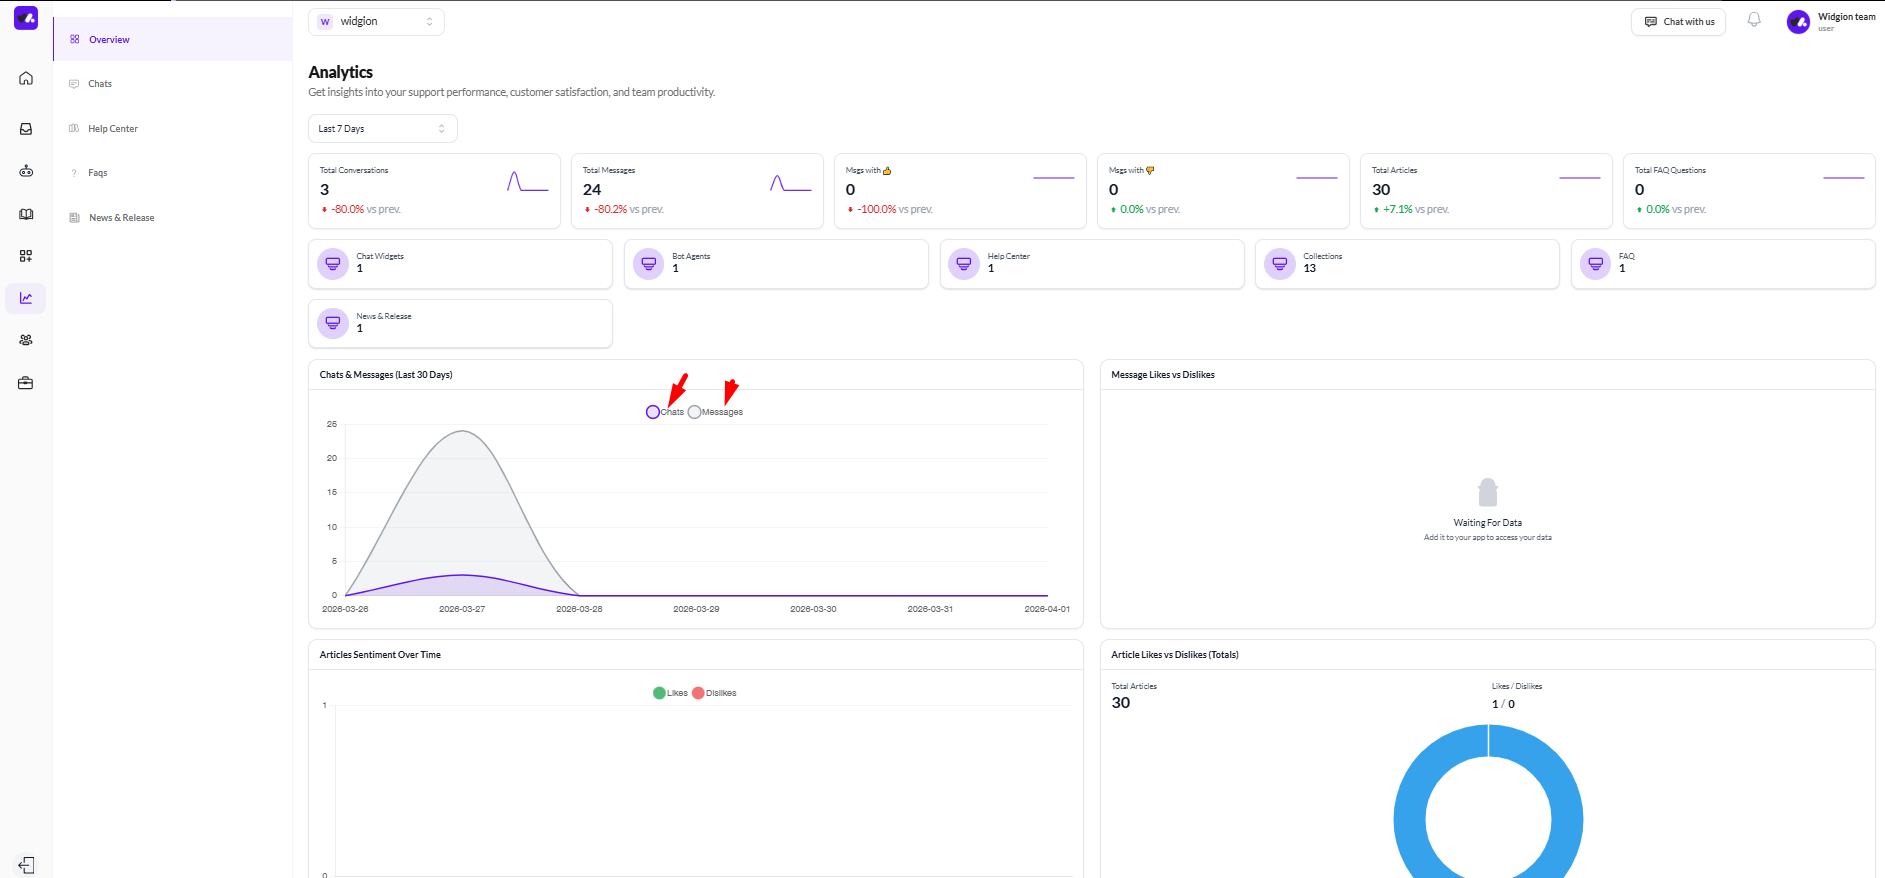
Chats & Messages Chart
The main chart on the dashboard is the Chats & Messages (Last 30 Days) graph. It plots both chats and messages over time, allowing you to spot activity spikes, quiet periods, and overall engagement trends. You can toggle between the Chats and Messages lines using the legend at the top of the chart.
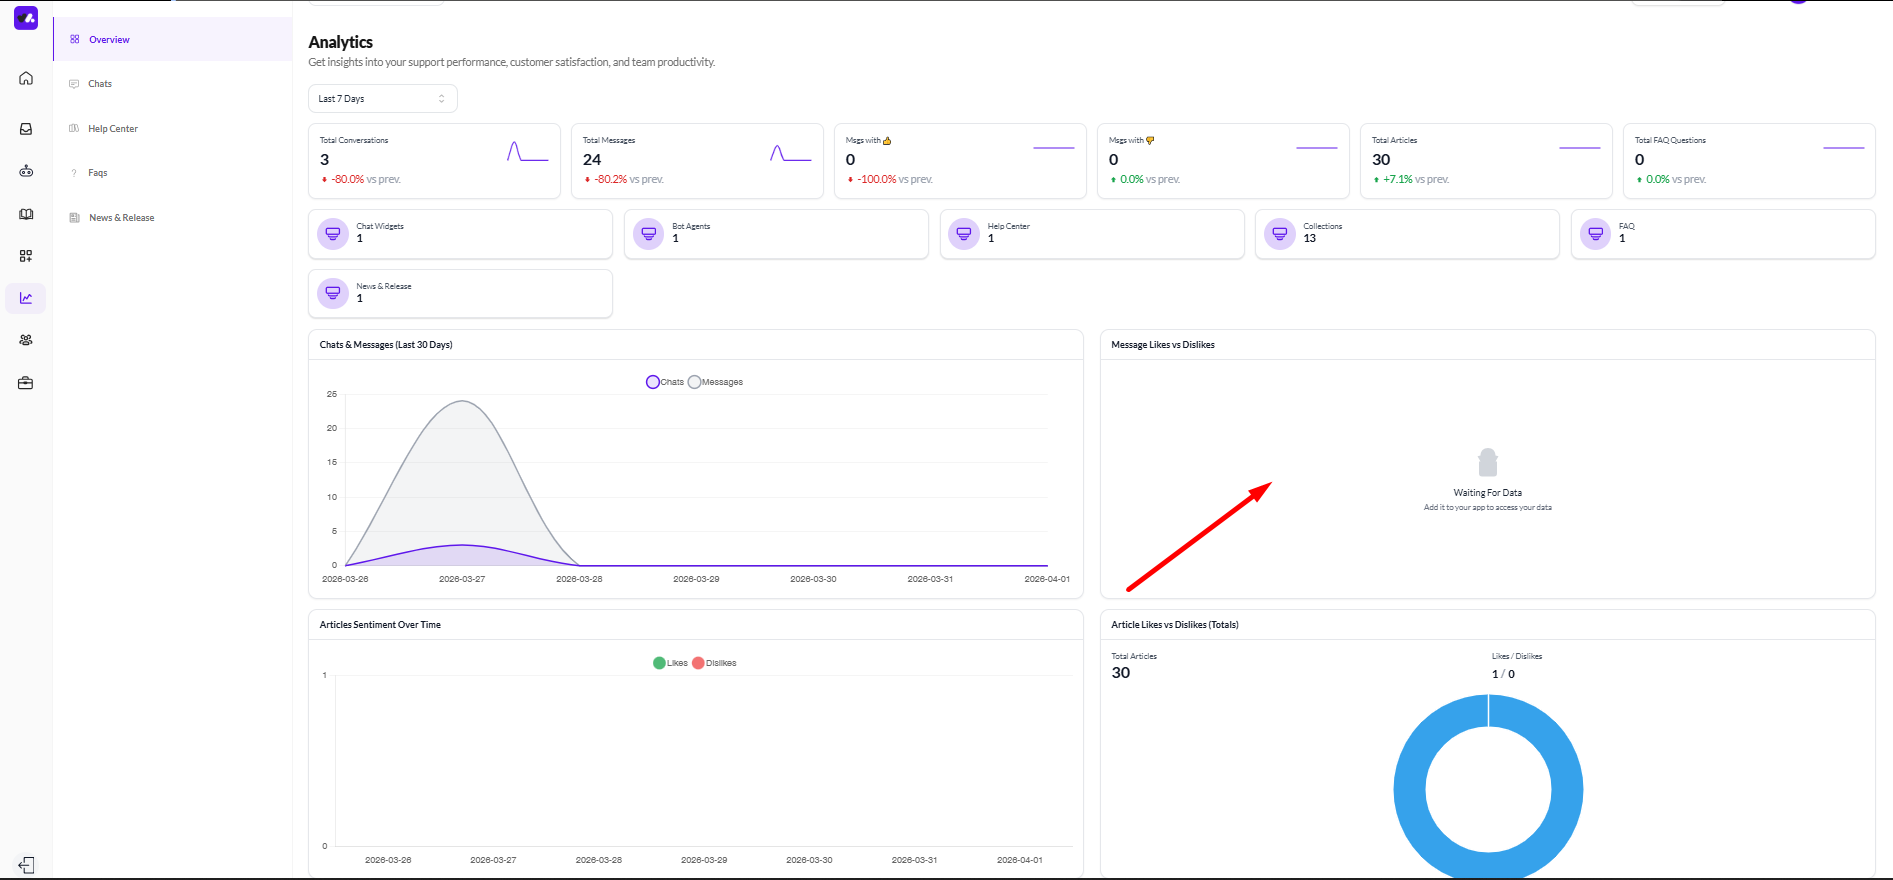
Message Likes vs Dislikes
The Message Likes vs Dislikes chart gives you a visual breakdown of how visitors are responding to your AI assistant's messages. When visitors rate responses using the thumbs up or thumbs down options during a conversation, those ratings are captured here, allowing you to see at a glance whether your assistant is delivering responses that visitors find helpful or not.
A high ratio of likes to dislikes is a strong signal that your training data and AI prompt are well configured.
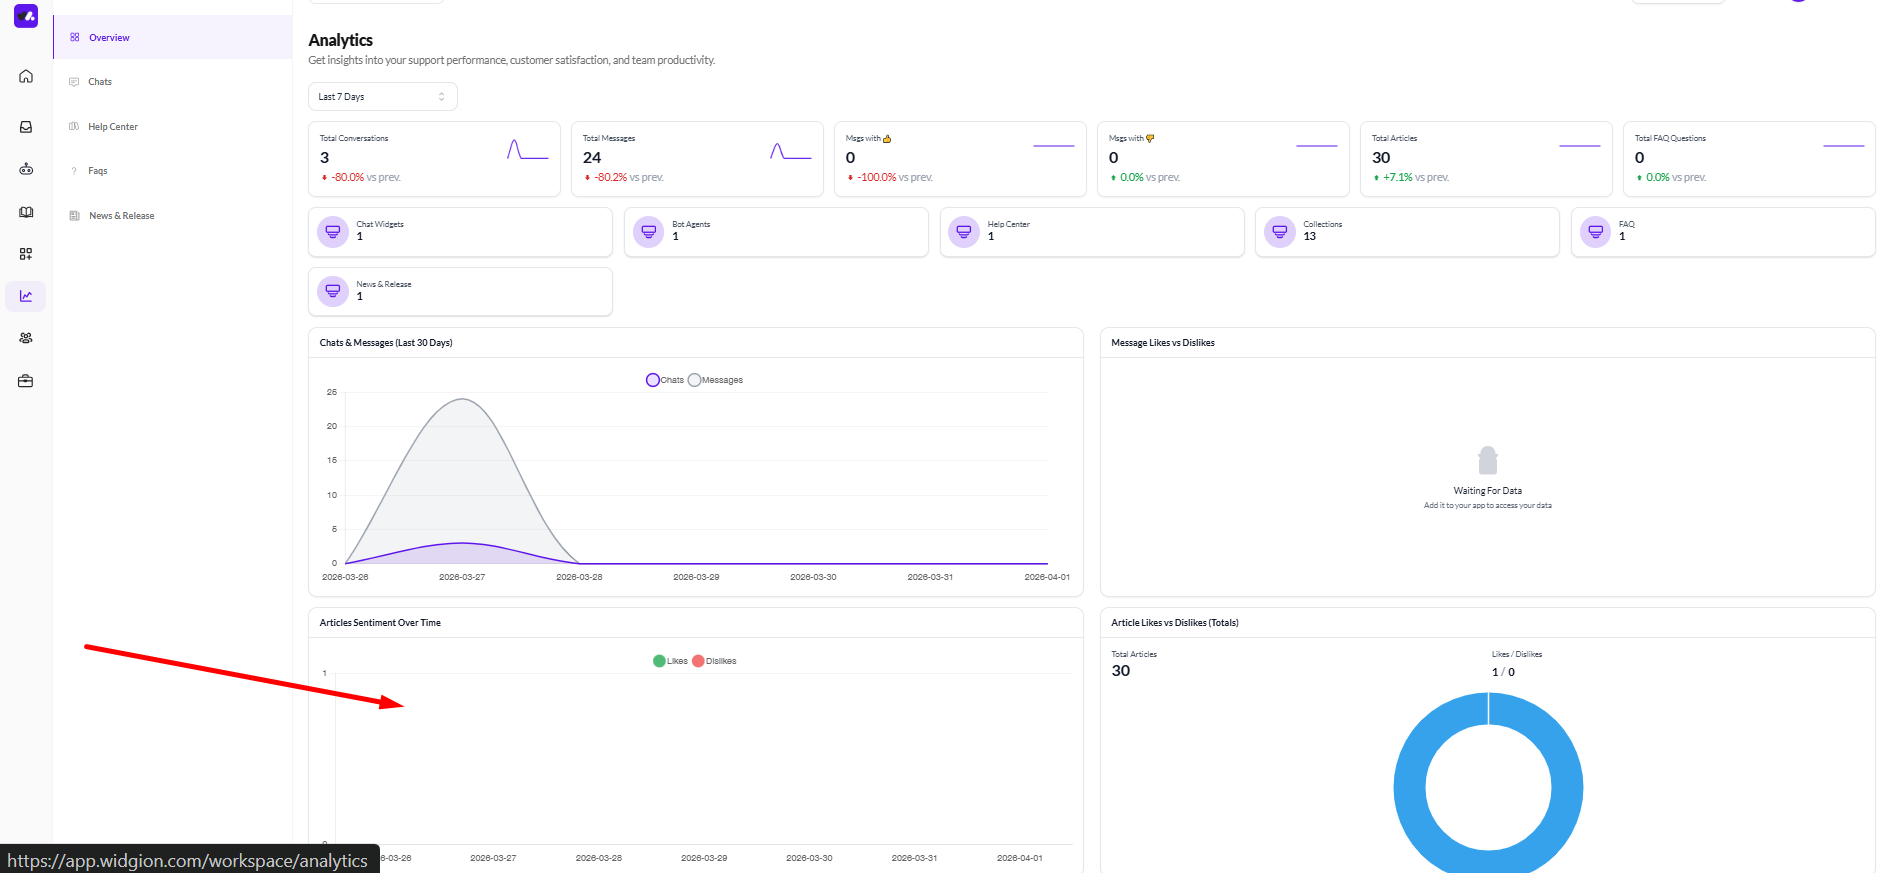
Articles Sentiment Over Time
The Articles Sentiment Over Time chart tracks how visitors are rating your Help Center articles over a selected period. It plots likes and dislikes as separate lines, so you can see trends in how your content is being received and whether specific time periods show a shift in visitor satisfaction.
A spike in dislikes on a particular date is a useful signal to investigate, it may indicate that an article was recently updated in a way that confused visitors, or that a new article isn't meeting expectations.
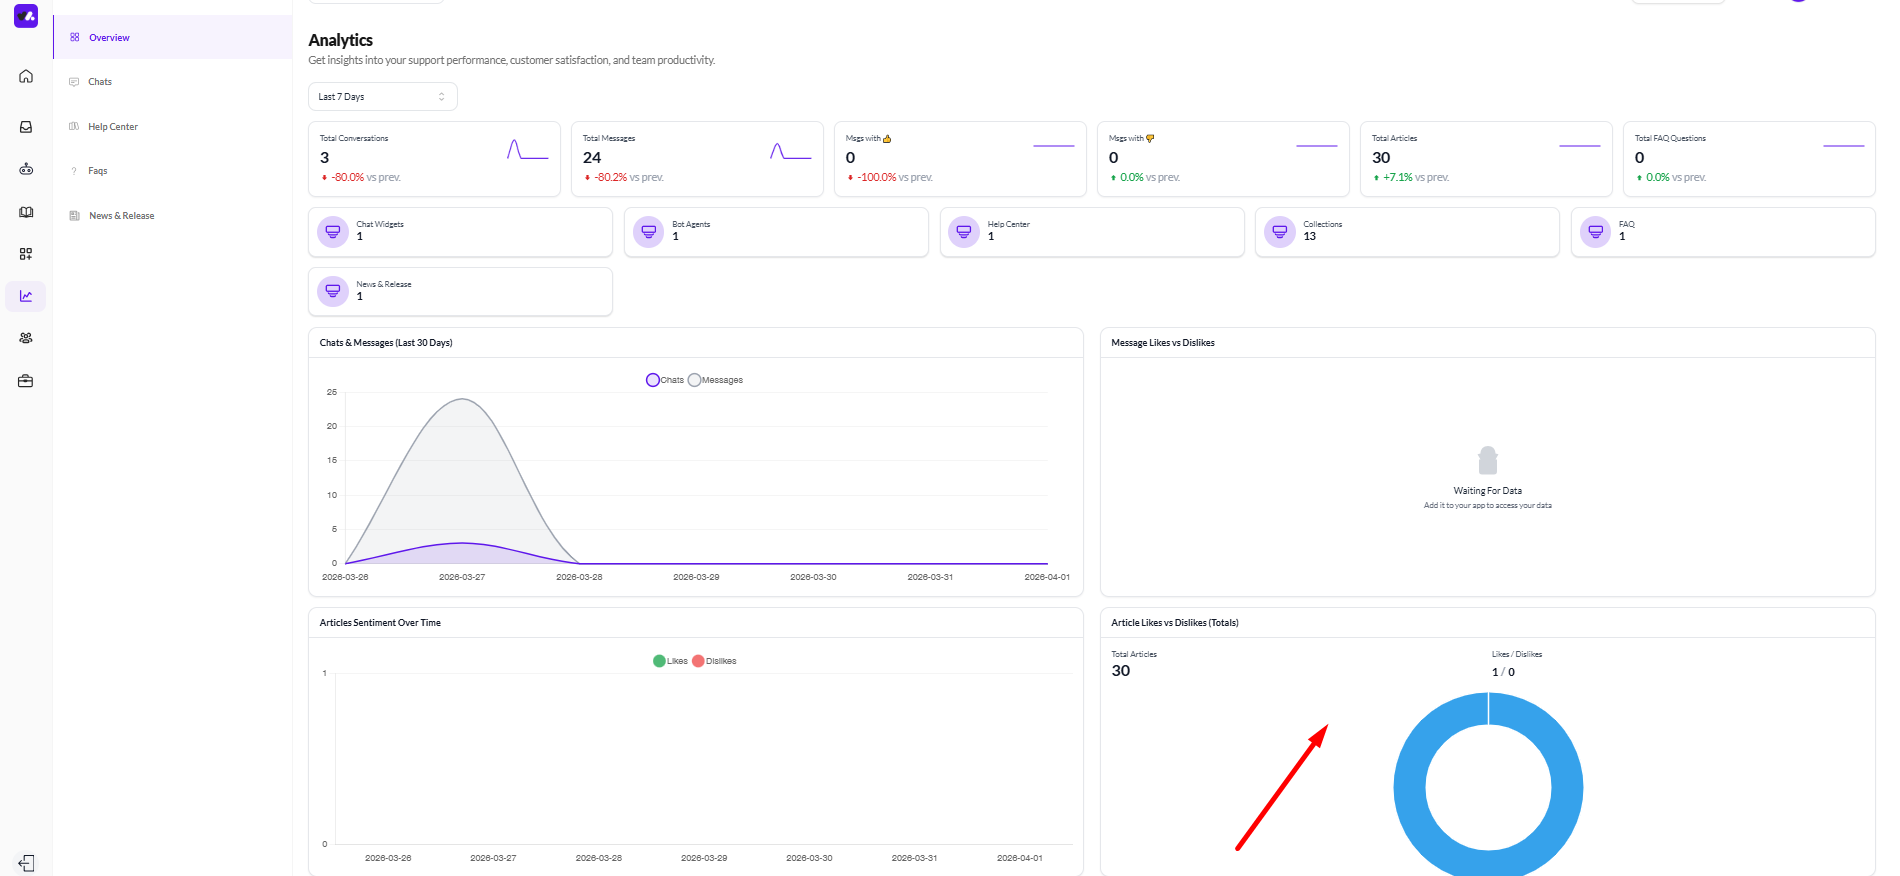
Article Likes vs Dislikes (Totals)
The Article Likes vs Dislikes (Totals) section shows your cumulative article feedback as a donut chart. It displays the total number of articles alongside the overall likes to dislikes ratio, giving you a single view of how your entire knowledge base is performing in terms of visitor satisfaction.
This is a useful reference for understanding the overall health of your Help Center content at a glance.
Numbers Tell a Story
The Analytics Overview is most useful when you check it regularly rather than occasionally. Tracking how your conversations and messages trend over time helps you spot when your widget is working well and when it might need attention, whether that means updating your training data, refining your AI prompt, or simply keeping up with a growing volume of visitor interactions.
Did this answer your question?
0 Likes
0 Unlikes