
Exploring the Analytics Overview Dashboard
Learn how to navigate Widgion Analytics, understand the key performance metrics available in your workspace, and use analytics data to evaluate your AI assistant’s performance and customer interactions.
The Widgion Analytics Overview dashboard provides insights into support performance, customer satisfaction, and team productivity. It brings together conversation activity, message engagement, content statistics, and trends to help you understand how your Widgion workspace is performing.
Accessing the Analytics Overview
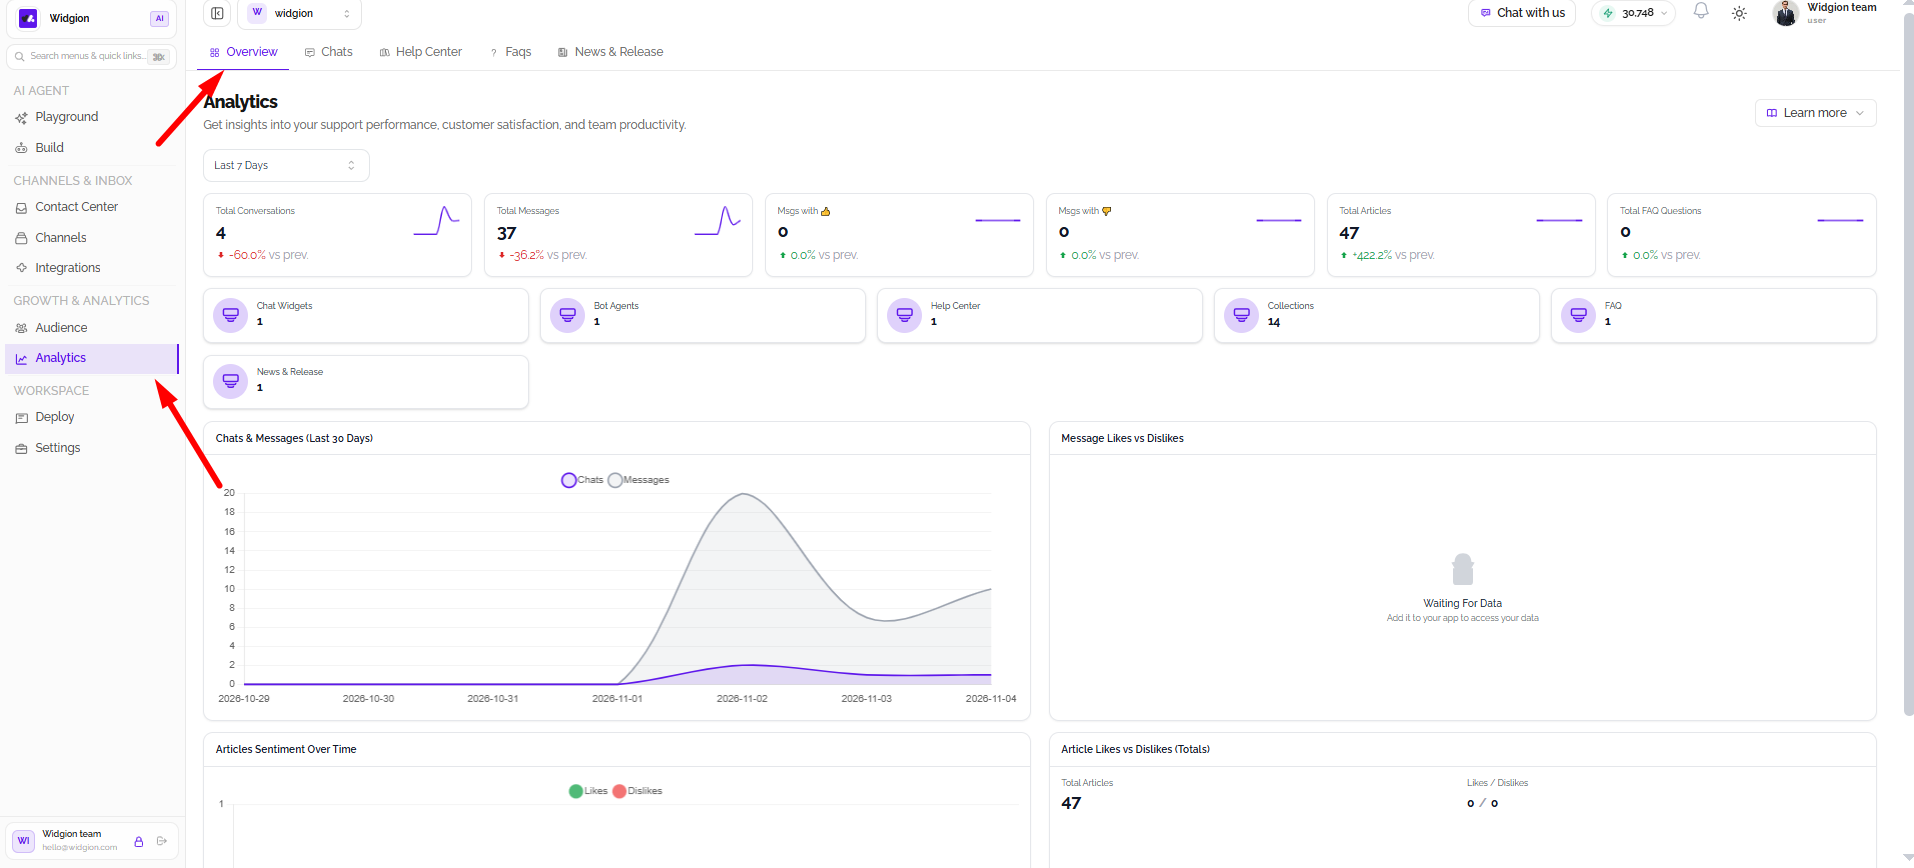
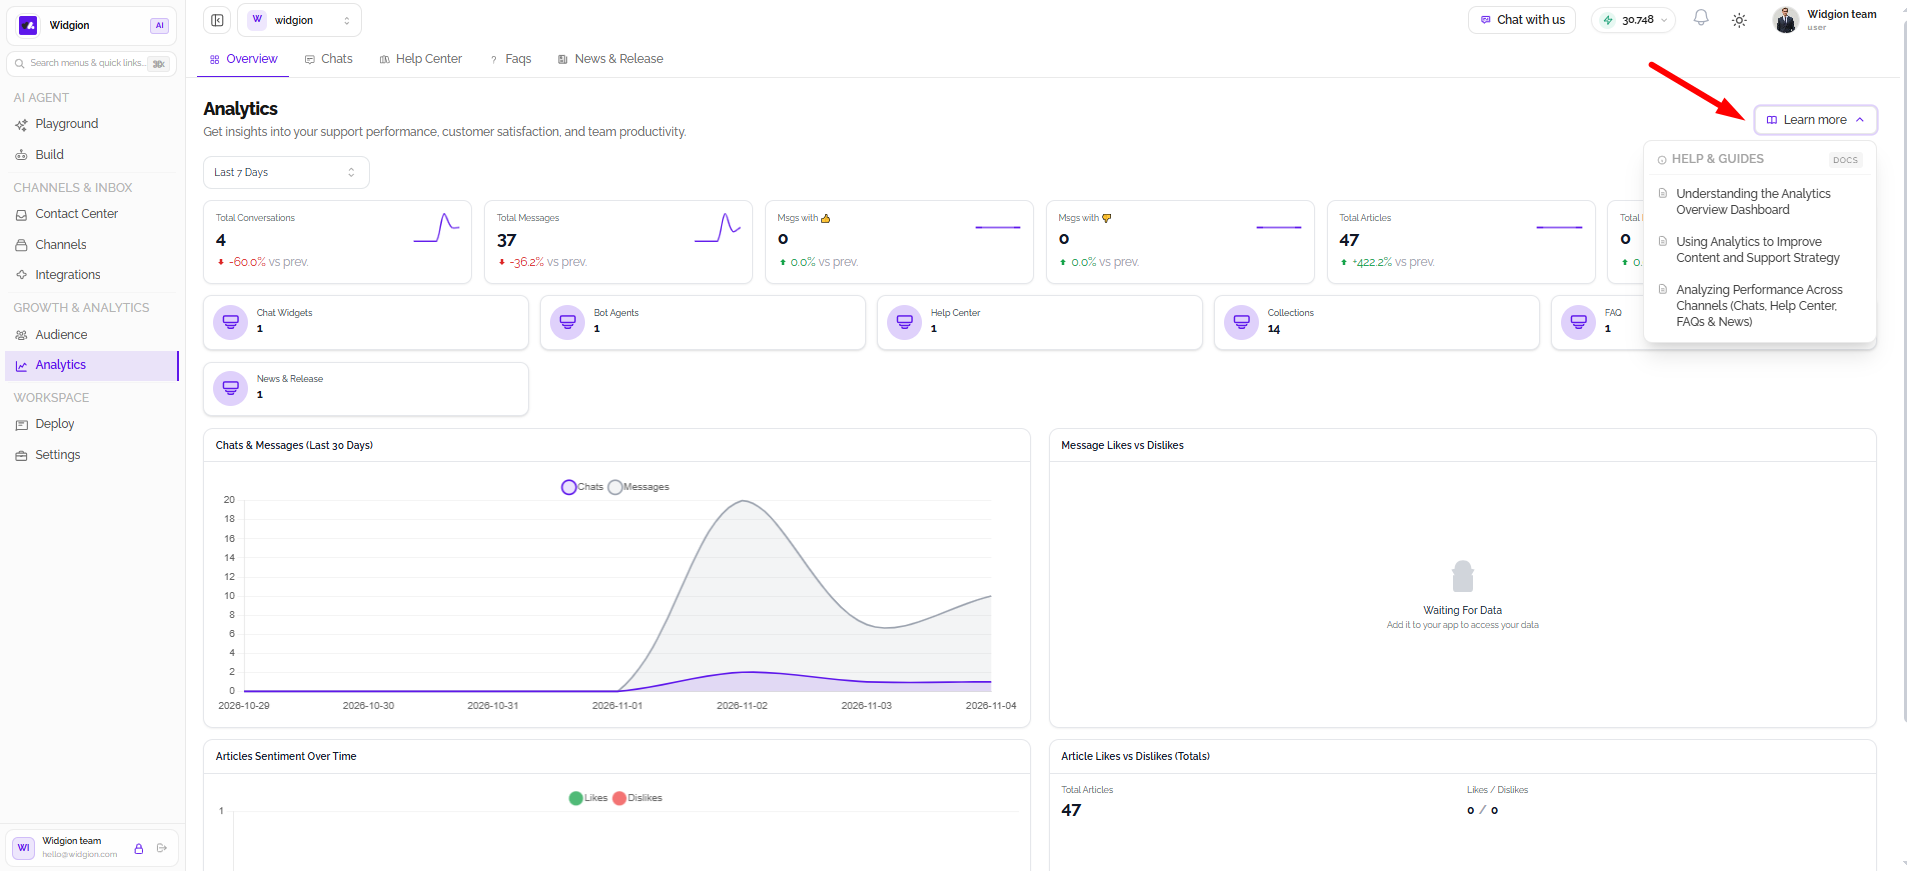
Select Analytics from the left-hand navigation menu. The Overview tab is displayed by default, alongside tabs for Chats, Help Center, FAQs, and News & Release. The Overview dashboard provides a general view of activity across these areas.
Filtering Analytics by Date
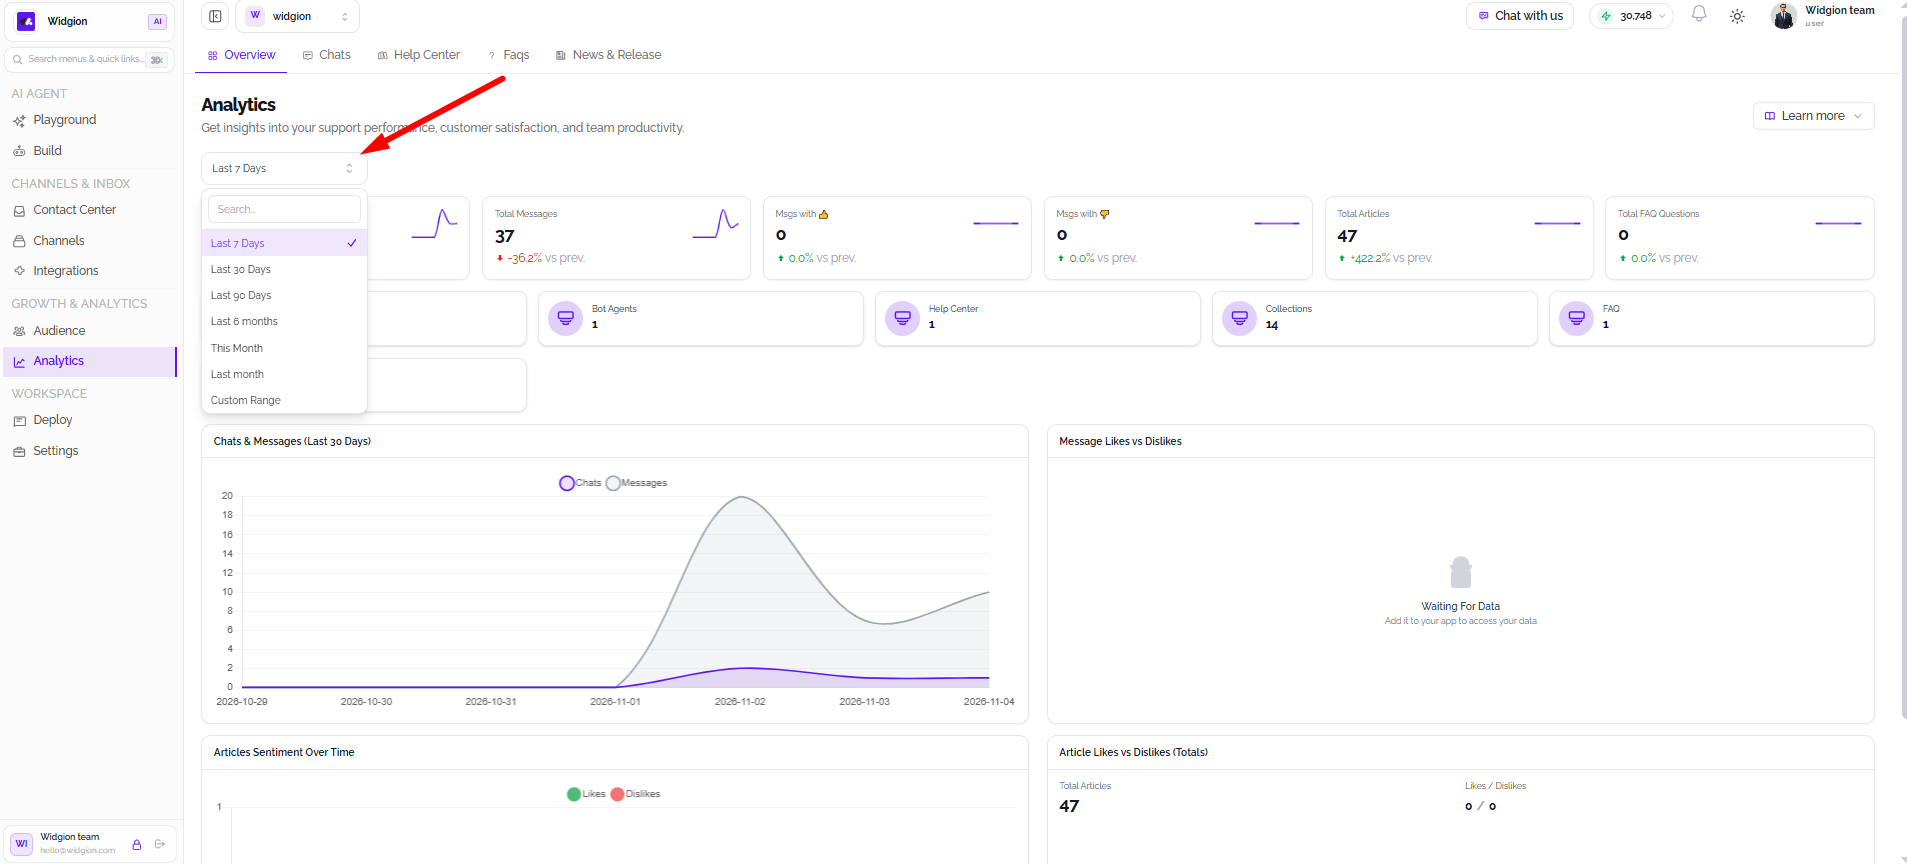
Use the date filter near the top of the dashboard to select the period you want to review. Available options include Last 7 Days, Last 30 Days, Last 90 Days, Last 6 Months, This Month, Last Month, and Custom Range.
Selecting a different period updates the dashboard to reflect the chosen timeframe.
Reviewing Key Performance Metrics
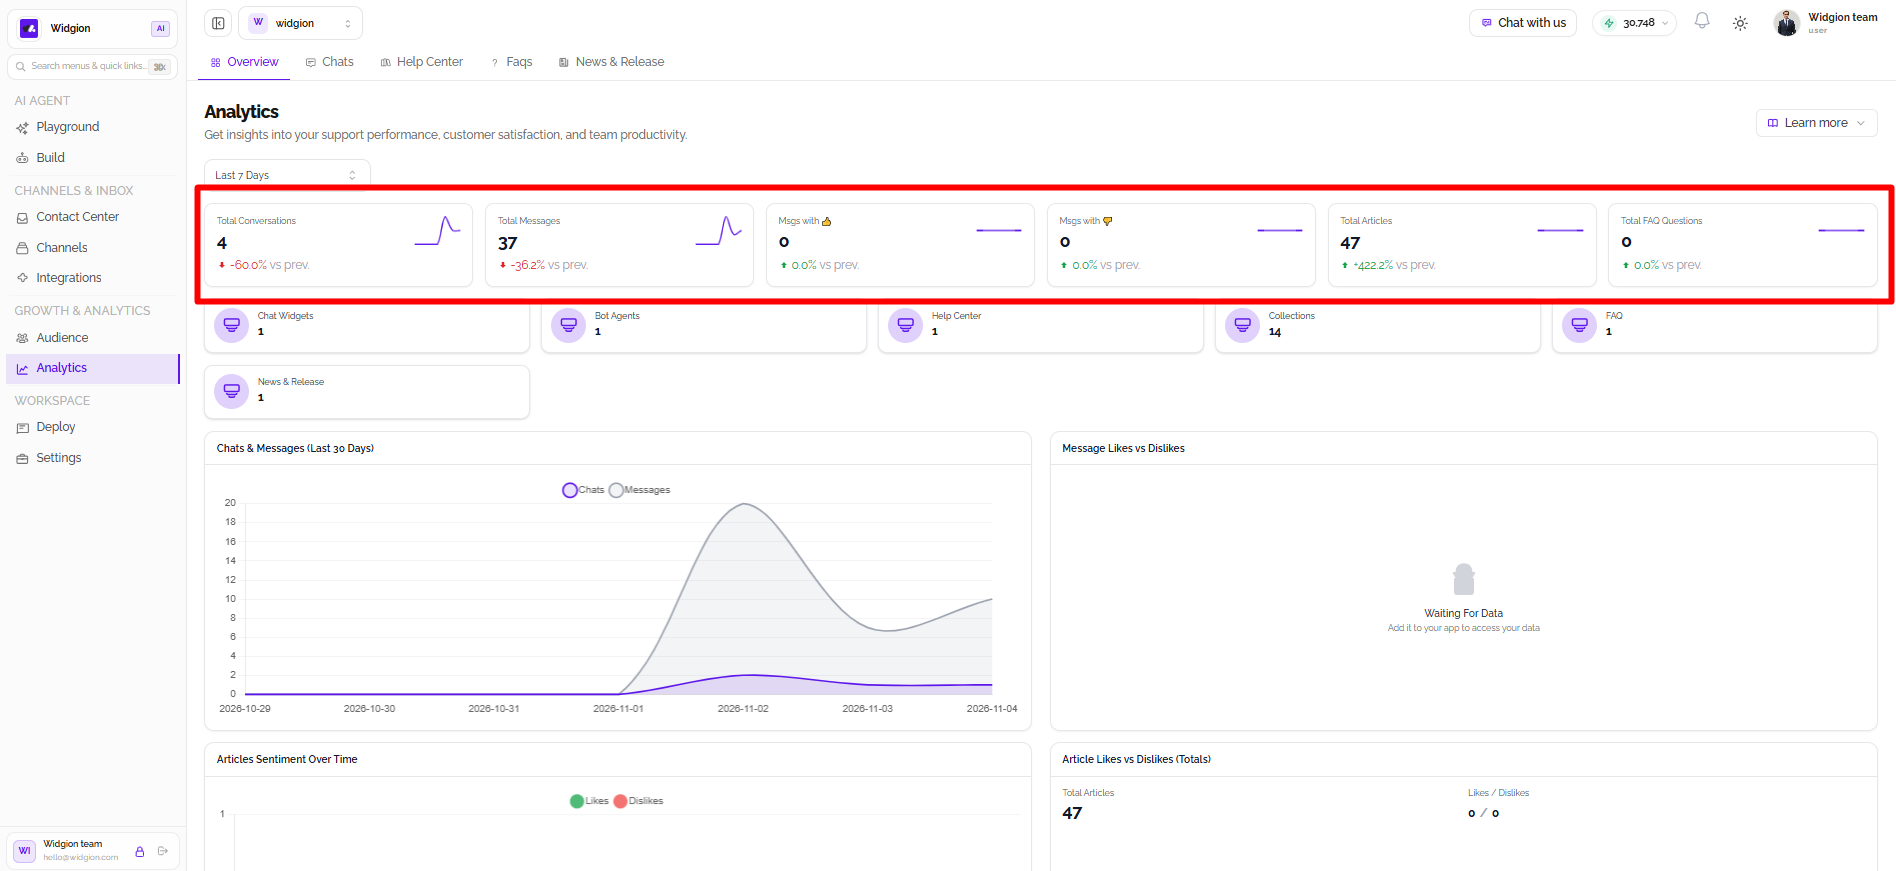
The dashboard displays key metrics for the selected period, including Total Conversations, Total Messages, Messages with Likes, Messages with Dislikes, Total Articles, and Total FAQ Questions. Each metric card shows a value and a comparison with the previous period, where available.
These figures provide a quick overview of conversation activity, message engagement, and the amount of support content available in your workspace.
Reviewing Workspace Content
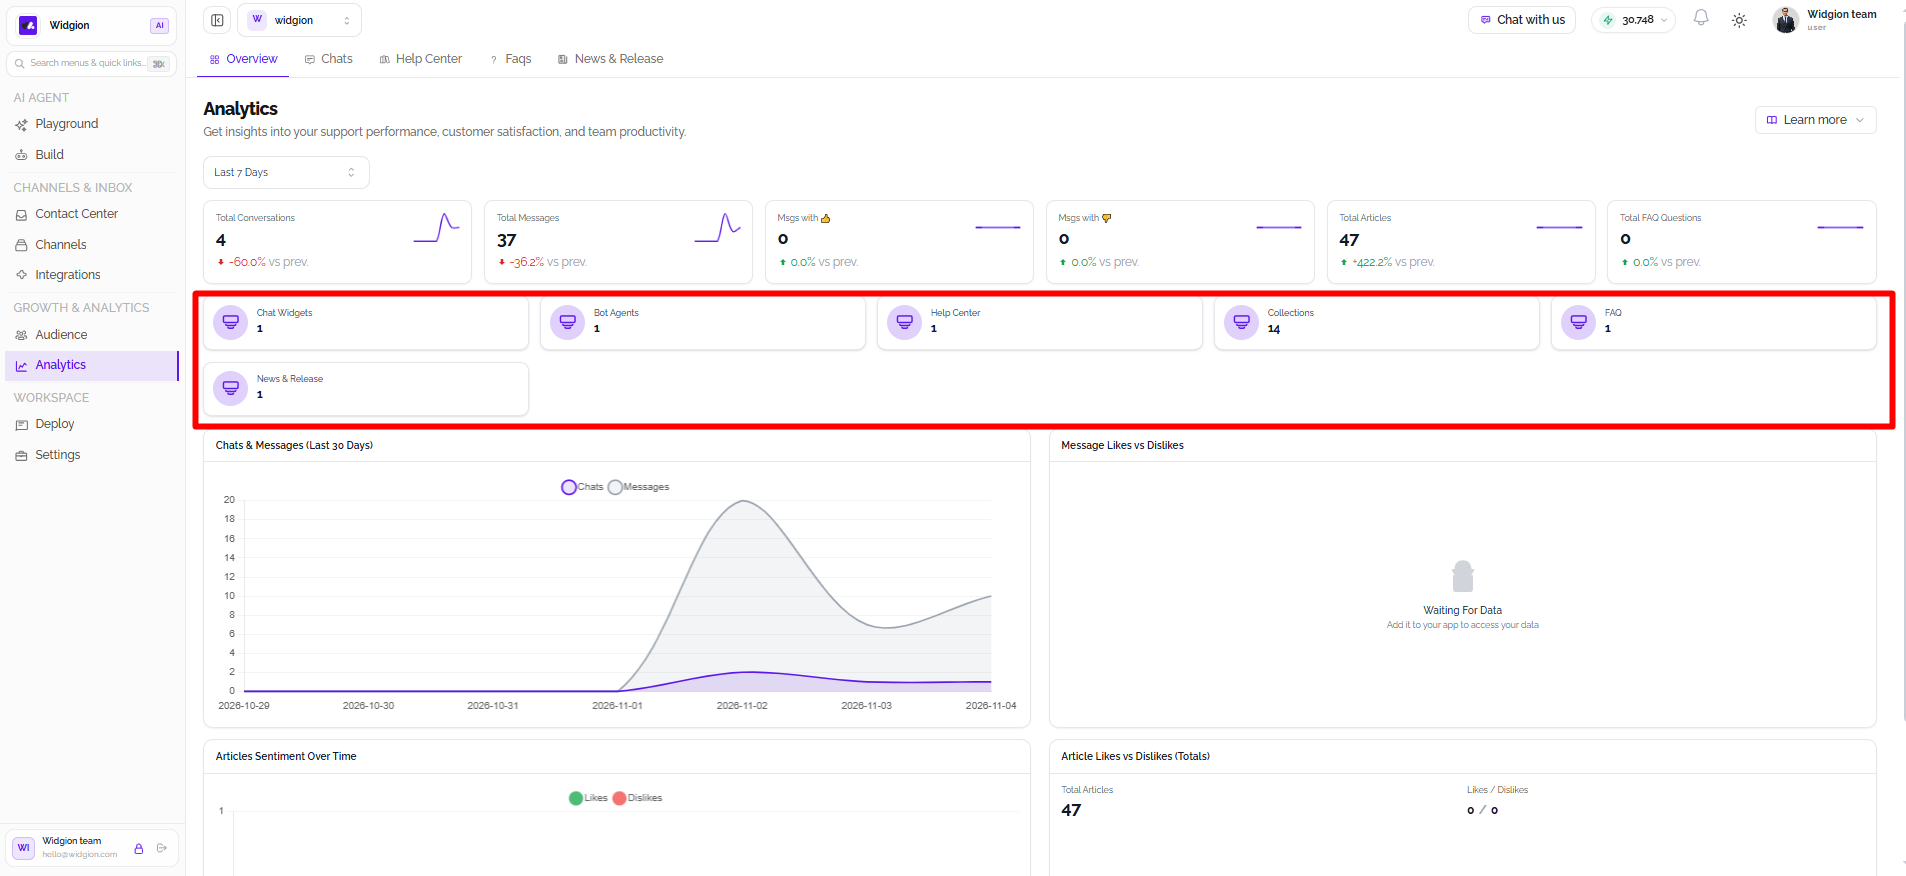
Below the main metrics, the dashboard displays counts for Chat Widgets, Bot Agents, Help Center, Collections, FAQ, and News & Release. These cards provide a snapshot of the resources configured in your Widgion workspace.
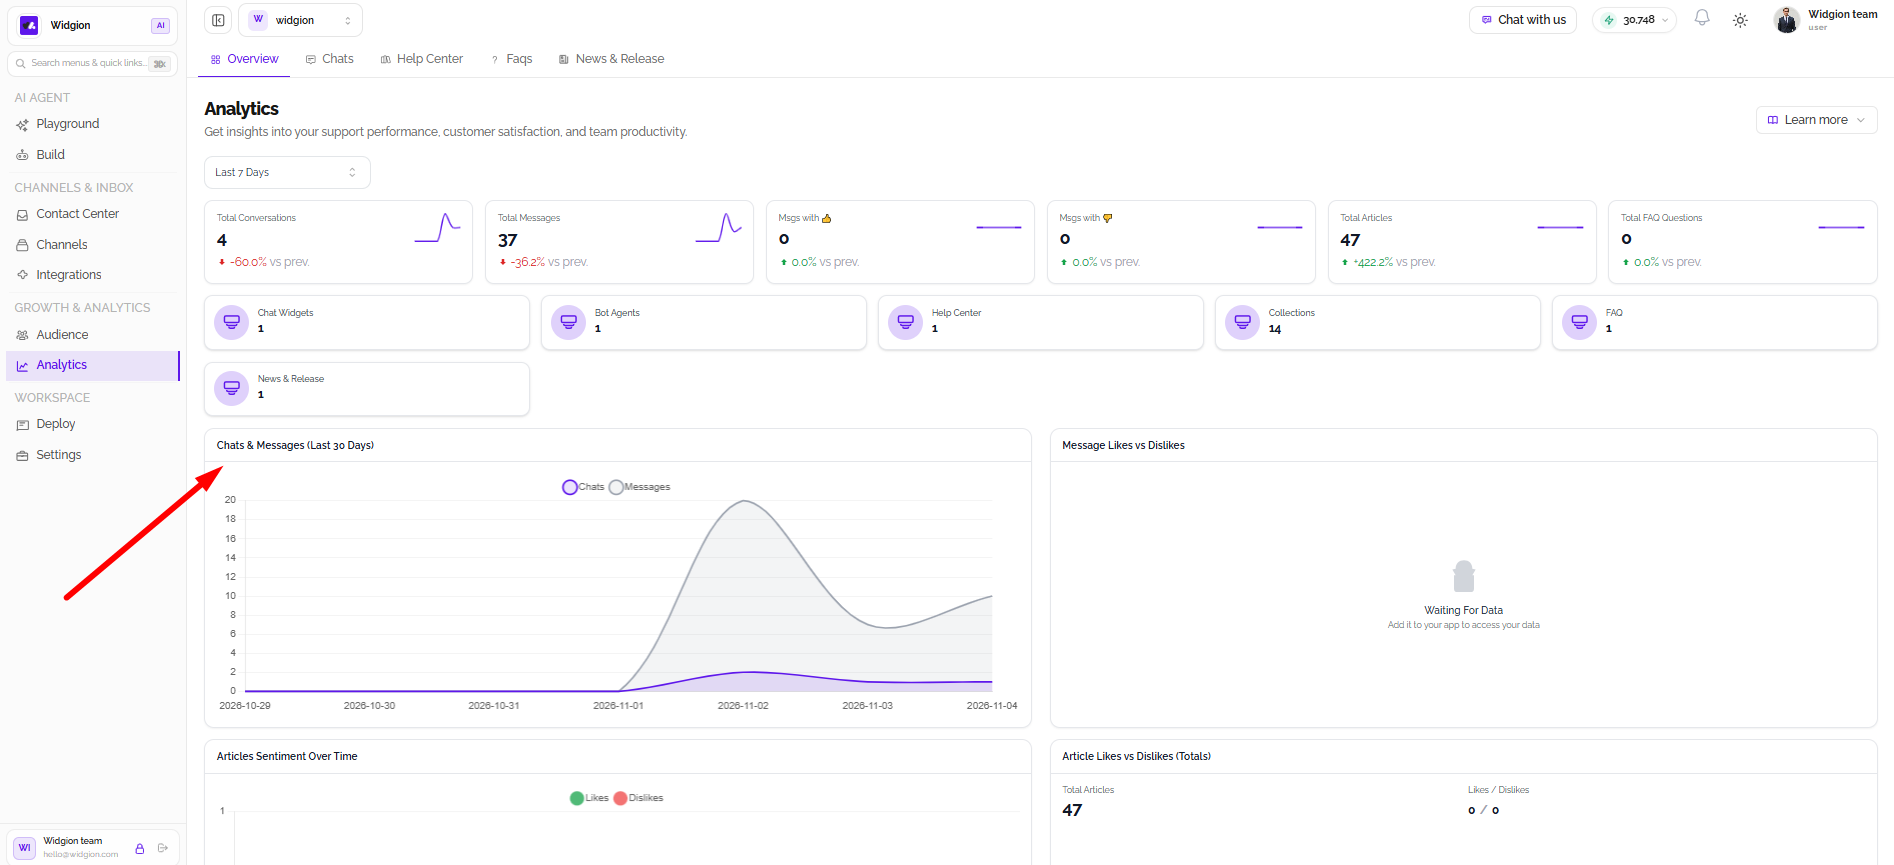
Analyzing Chats and Messages
The Chats & Messages chart visualizes conversation and message activity over time. Use the chart legend to view Chats or Messages and compare their trends across the displayed dates.
This chart helps you identify changes in support activity and periods when visitors are interacting more frequently with your assistant.
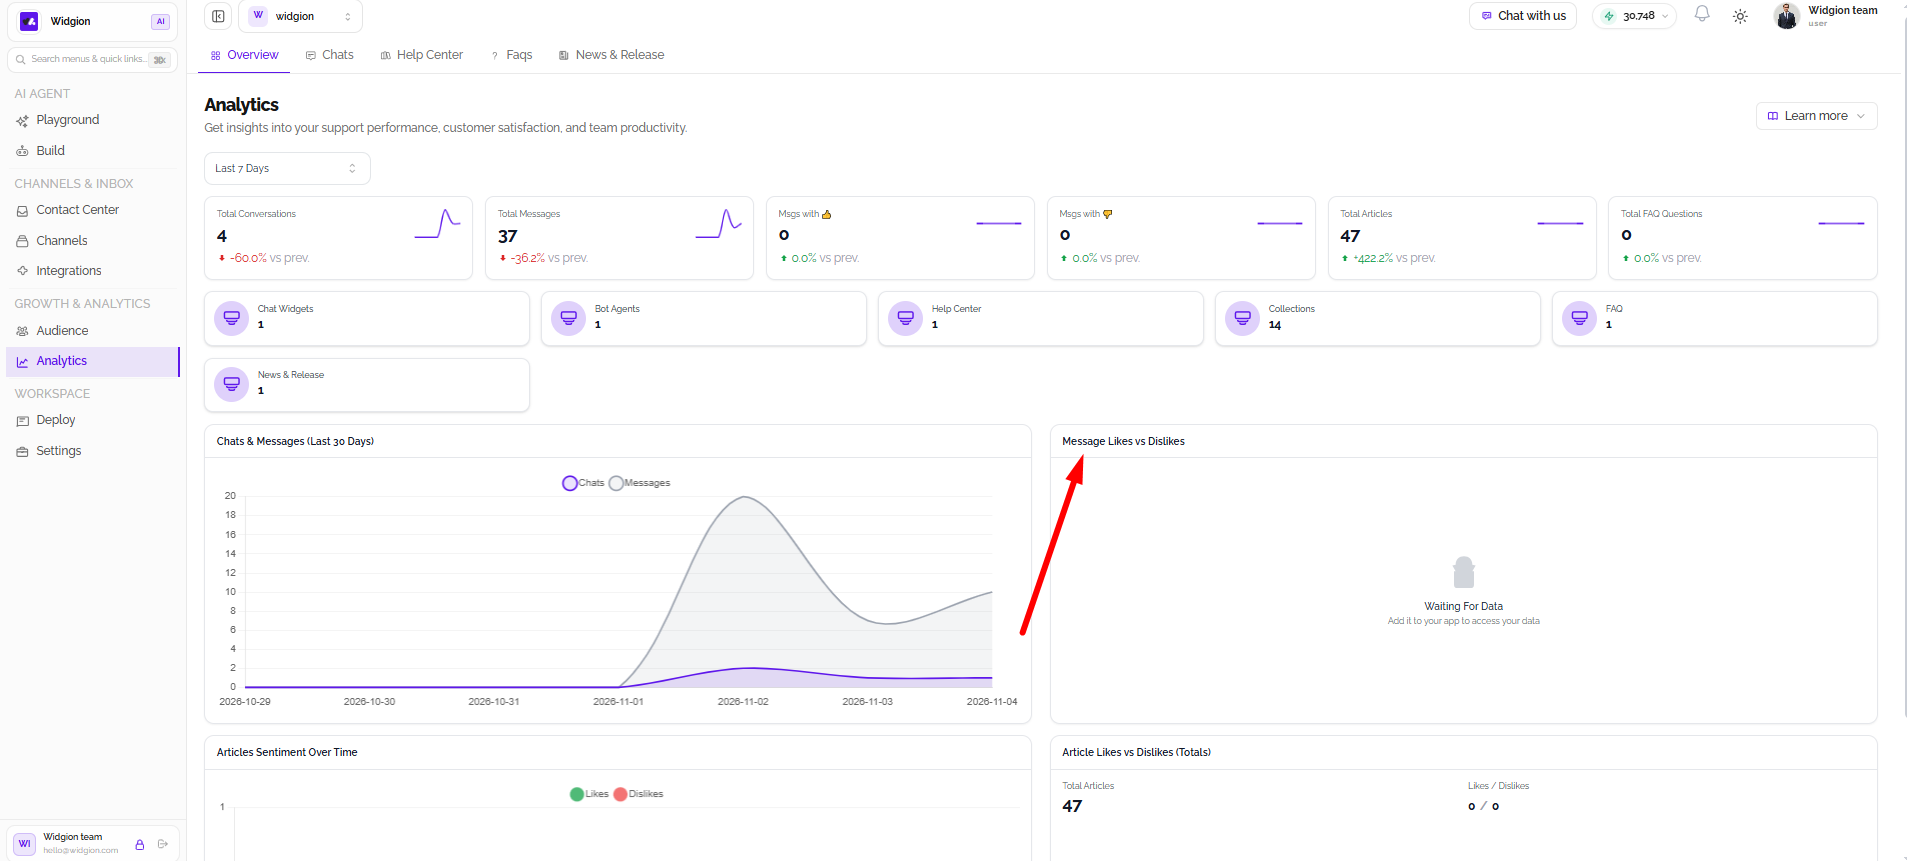
Reviewing Message Likes and Dislikes
The Message Likes vs Dislikes panel displays engagement feedback for assistant messages. When feedback data is unavailable, the panel shows a Waiting For Data message indicating that the app needs to be added to access the data.
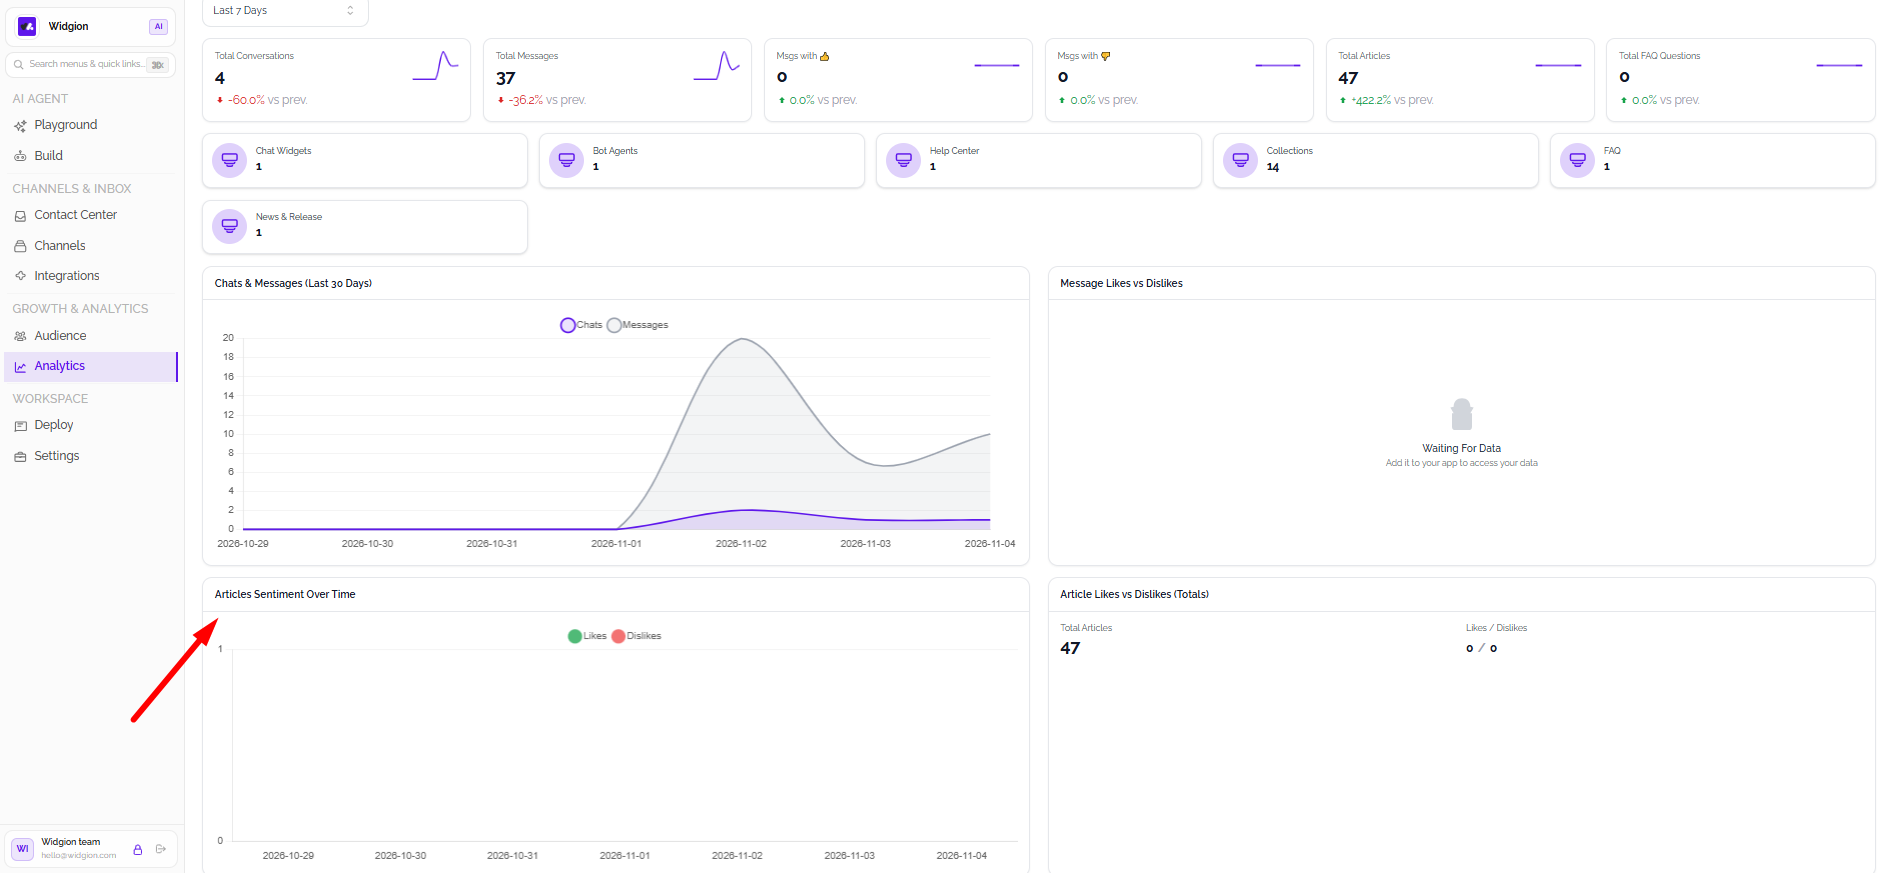
Tracking Article Sentiment Over Time
The Articles Sentiment Over Time chart displays article feedback trends using Likes and Dislikes. It helps you review how visitors respond to your Help Center content over time.
When feedback activity is available, use the chart to observe changes in article sentiment.
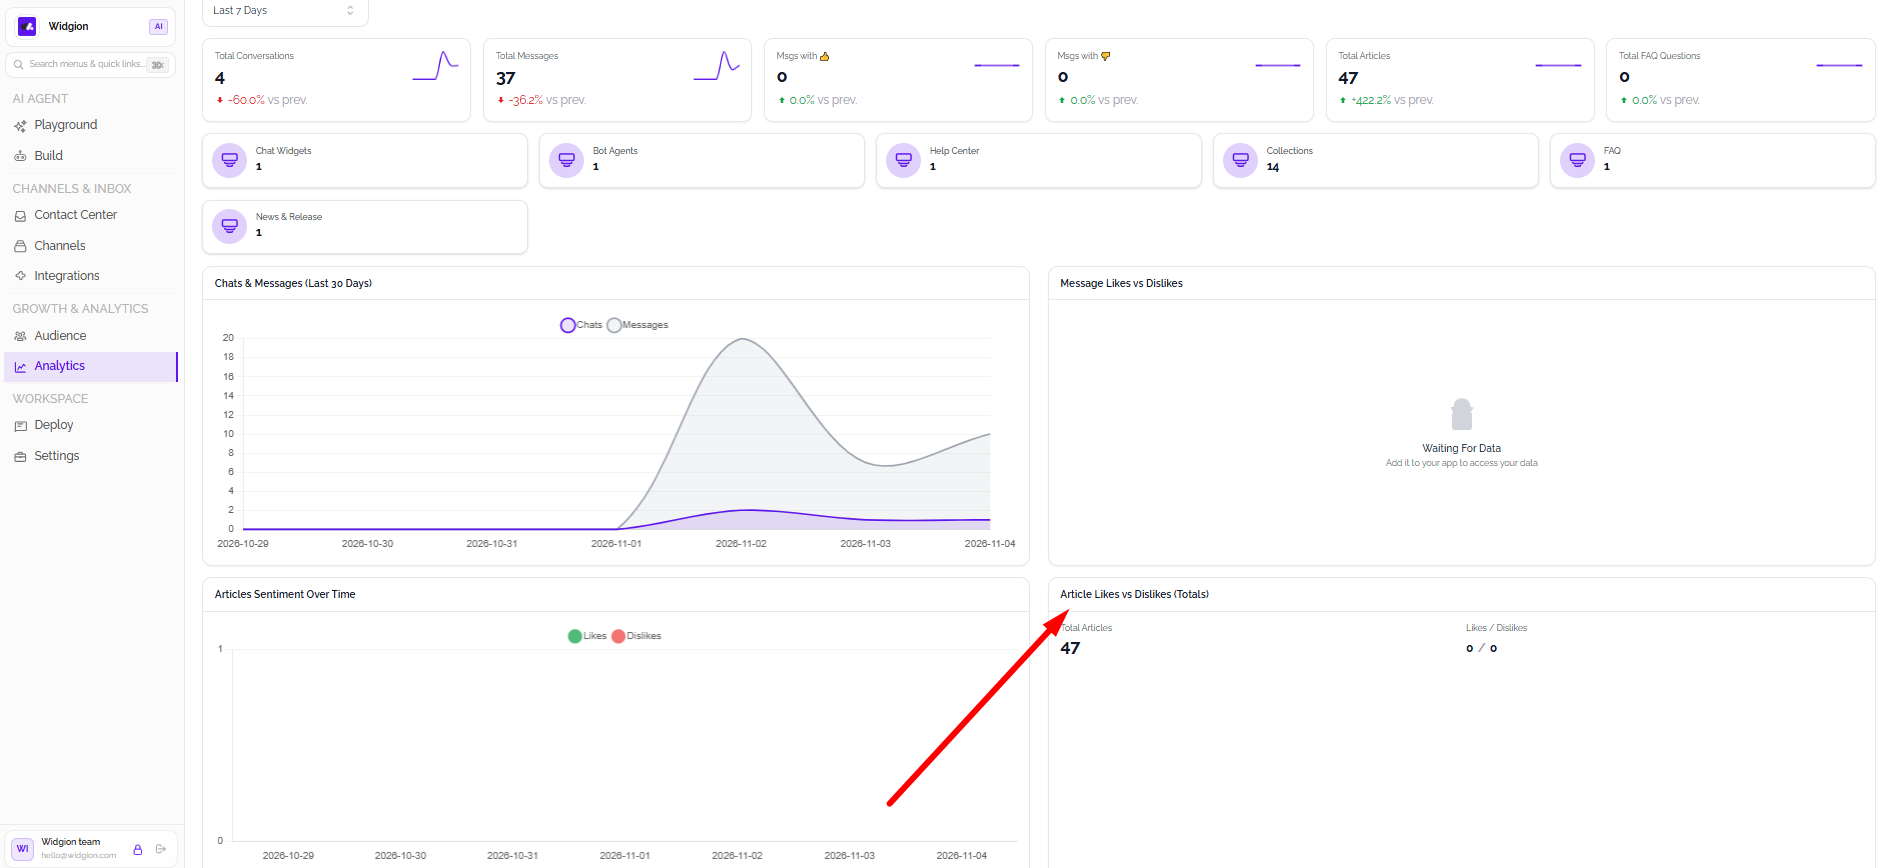
Reviewing Total Article Feedback
The Article Likes vs Dislikes (Totals) panel displays the total number of articles alongside the overall likes and dislikes received. This provides a consolidated view of feedback on your Help Center content.
Accessing Analytics Help Guides
Select Learn more in the upper-right corner of the dashboard to access the available Help & Guides resources. The menu includes guides for understanding the Analytics Overview dashboard, improving content and support strategy with analytics, and analyzing performance across Chats, Help Center, FAQs, and News.
Using Analytics to Improve Support Performance
Use the Analytics Overview dashboard to monitor support activity, review customer feedback, and understand how your content is performing. Adjust the date range to compare different periods and identify trends that may require attention.
For more detailed insights, open the Chats, Help Center, FAQs, or News & Release tabs to explore analytics for individual areas of your Widgion workspace.
Did this answer your question?
What was missing or unclear?
Thank you for your feedback!
Your input helps us make this article better.
Still need help?
Contact support →Related articles
Understanding Chat Agent Analytics
Discover how to use Agent Analytics in Widgion to review your AI assistant’s activity, evaluate interaction performance, and identify opportunities to improve customer experiences.
Understanding Knowledge Base Analytics
Learn how to review Knowledge Base Analytics to understand how your knowledge sources support the AI assistant and identify opportunities to improve the information available to customers.
Installing the Chat Widget on Your Website
Step-by-step guide to embedding the chat widget on your website.
Adding, Editing, and Managing Contact Data
Handles actions like adding contacts, editing details, deleting, and exporting.
On this page