
Understanding Knowledge Base Analytics
Learn how to review Knowledge Base Analytics to understand how your knowledge sources support the AI assistant and identify opportunities to improve the information available to customers.
Knowledge Base Analytics helps you understand how visitors interact with your Help Center content. It provides insights into article performance, user activity, collection growth, search behavior, and feedback, allowing you to identify popular content and areas that may need improvement.
Accessing Knowledge Base Analytics
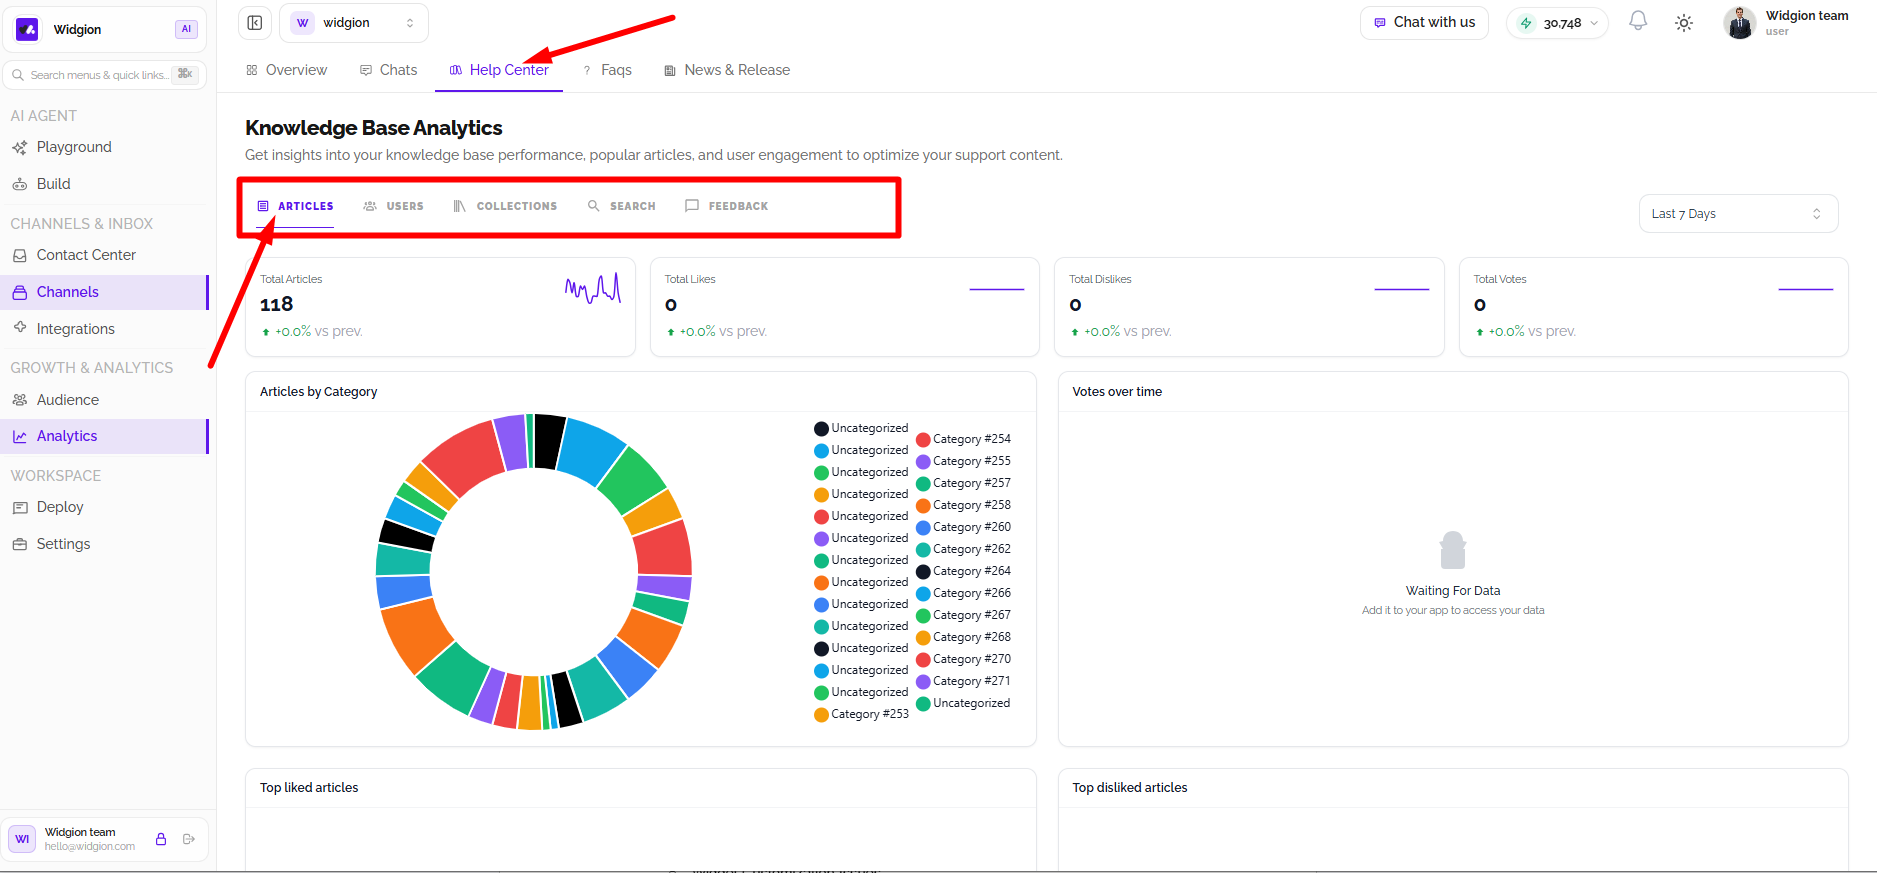
Navigate to Analytics from the left sidebar, then open the Help Center tab in the top navigation. The Knowledge Base Analytics dashboard displays several sections that provide different perspectives on your Help Center’s performance.
The dashboard is divided into Articles, Users, Collections, Search, and Feedback. Each section contains metrics, charts, or tables relevant to its category.
Reviewing Article Performance
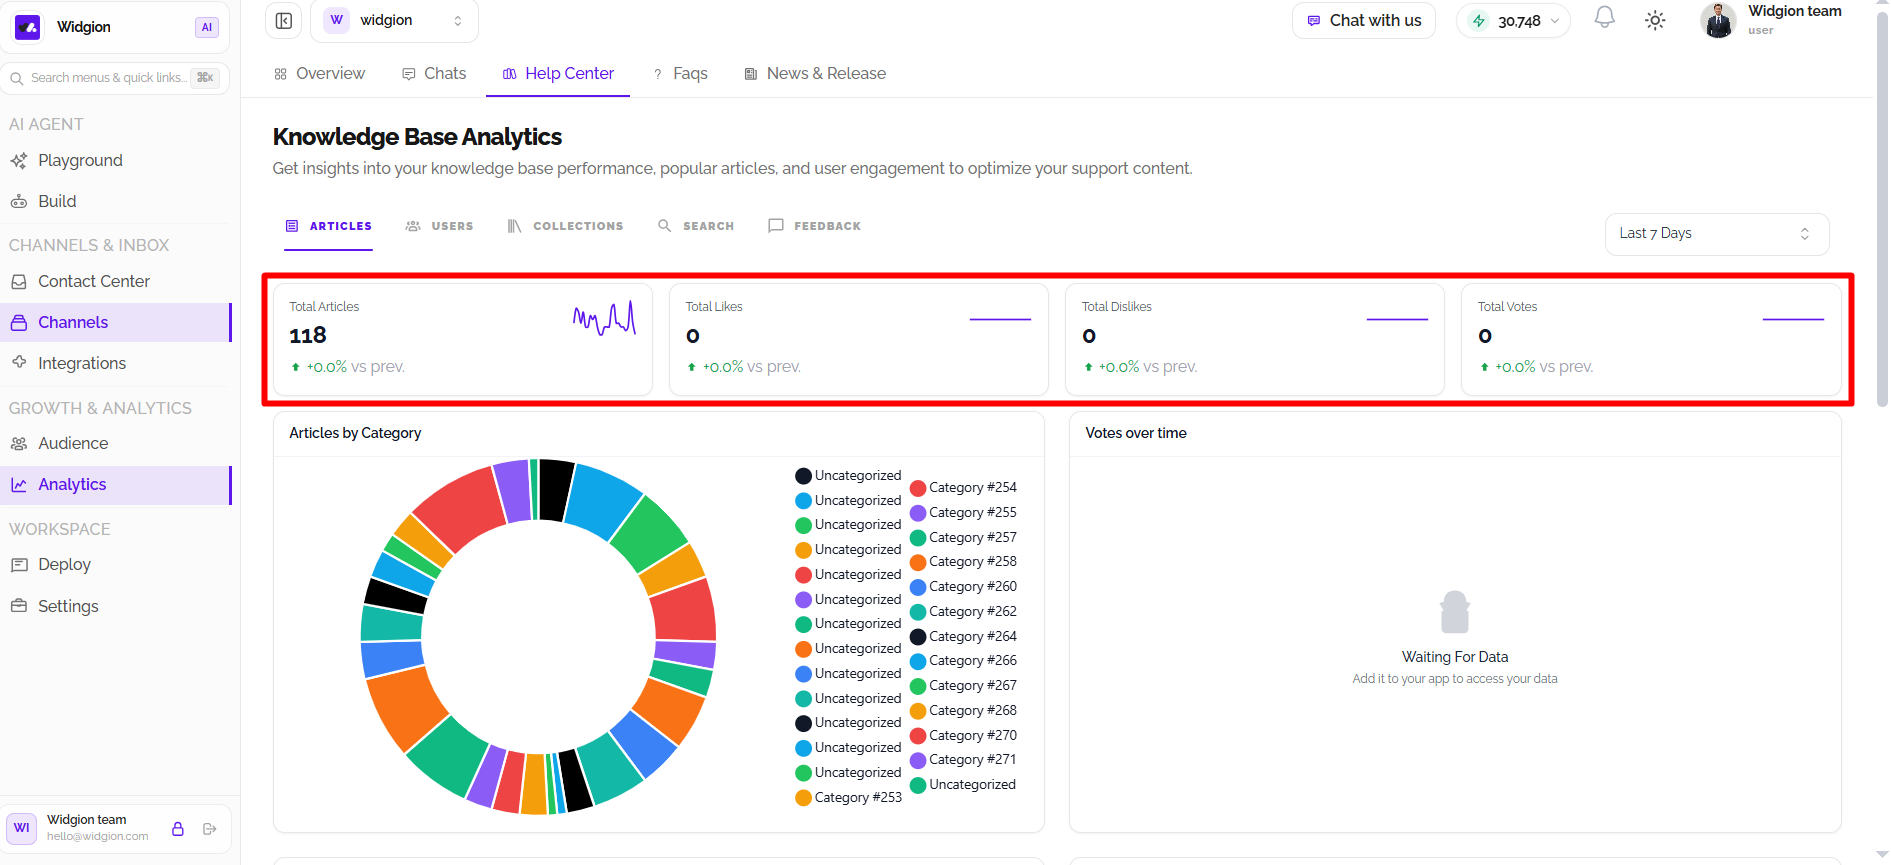
The Articles tab provides an overview of your knowledge base content. The metric cards display Total Articles, Total Likes, Total Dislikes, and Total Votes, helping you monitor article volume and reader feedback.
The Articles by Category chart shows how articles are distributed across categories. The Votes over time chart tracks voting activity, while the Top liked articles and Top disliked articles panels highlight content based on reader reactions. The Top Viewed Articles table lists articles by views, including their titles and view counts.
Understanding User Analytics
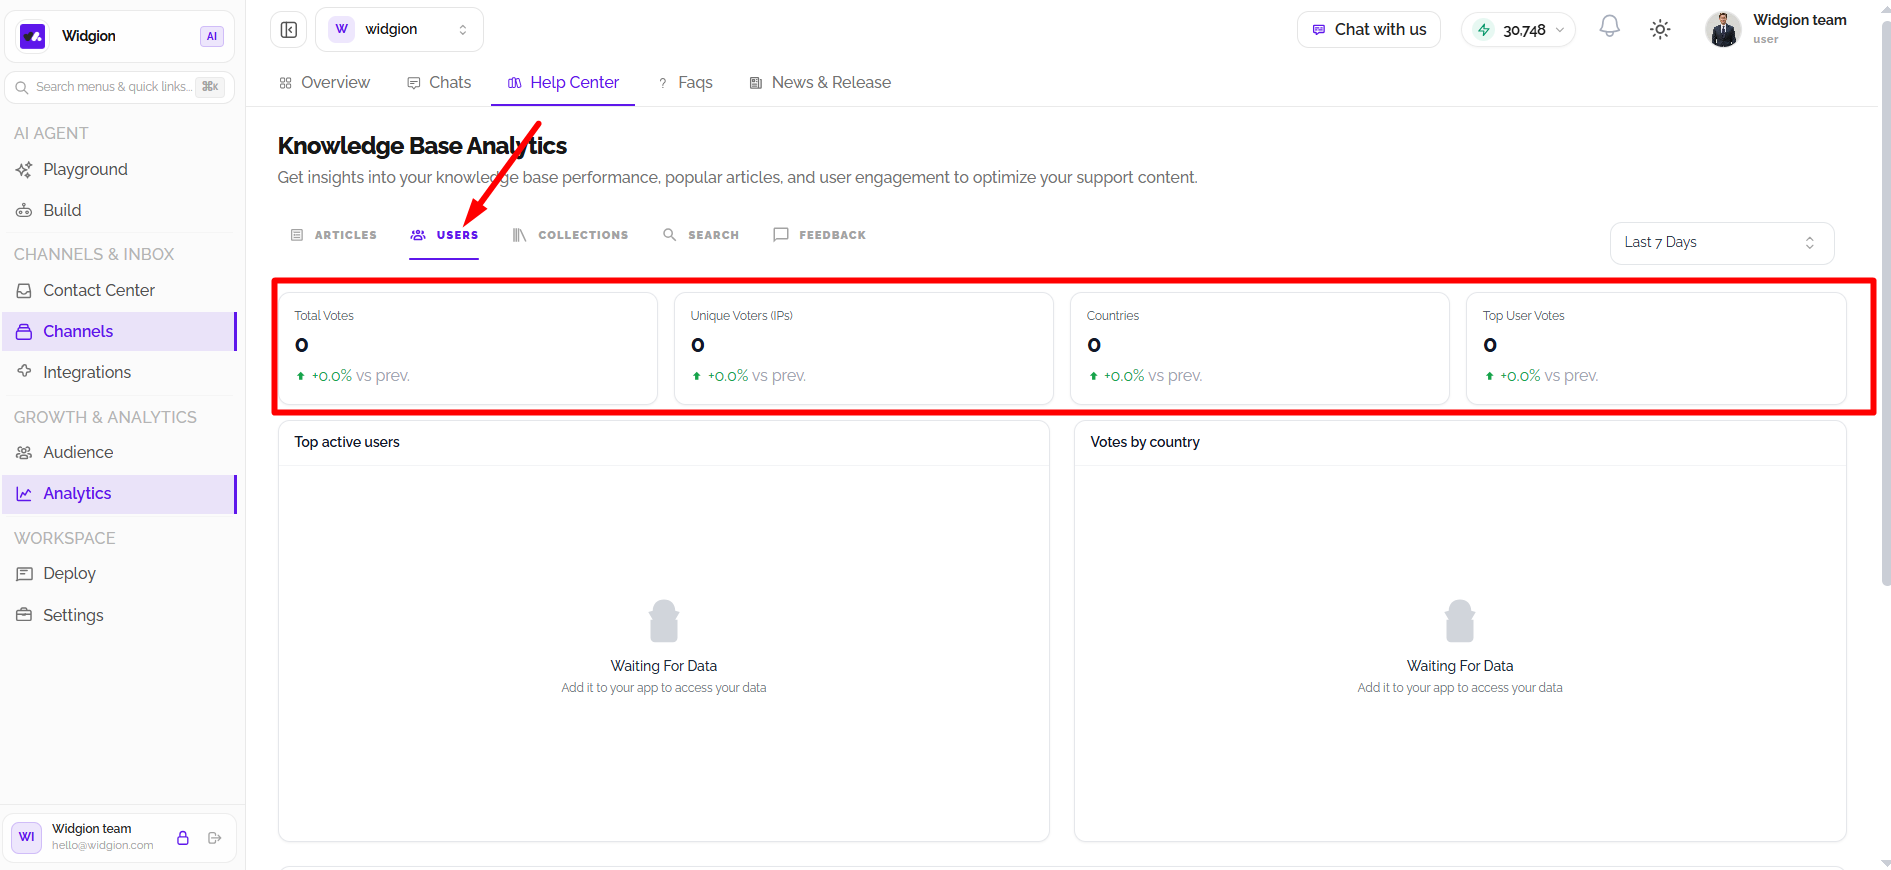
The Users tab focuses on feedback activity from Help Center visitors. Its metric cards show Total Votes, Unique Voters (IPs), Countries, and Top User Votes.
The dashboard also includes panels for Top active users, Votes by country, and Votes by IP Address. These sections provide a view of voting activity by user, location, and IP address. When data is unavailable, the panels display a waiting-for-data message.
Monitoring Collection Analytics
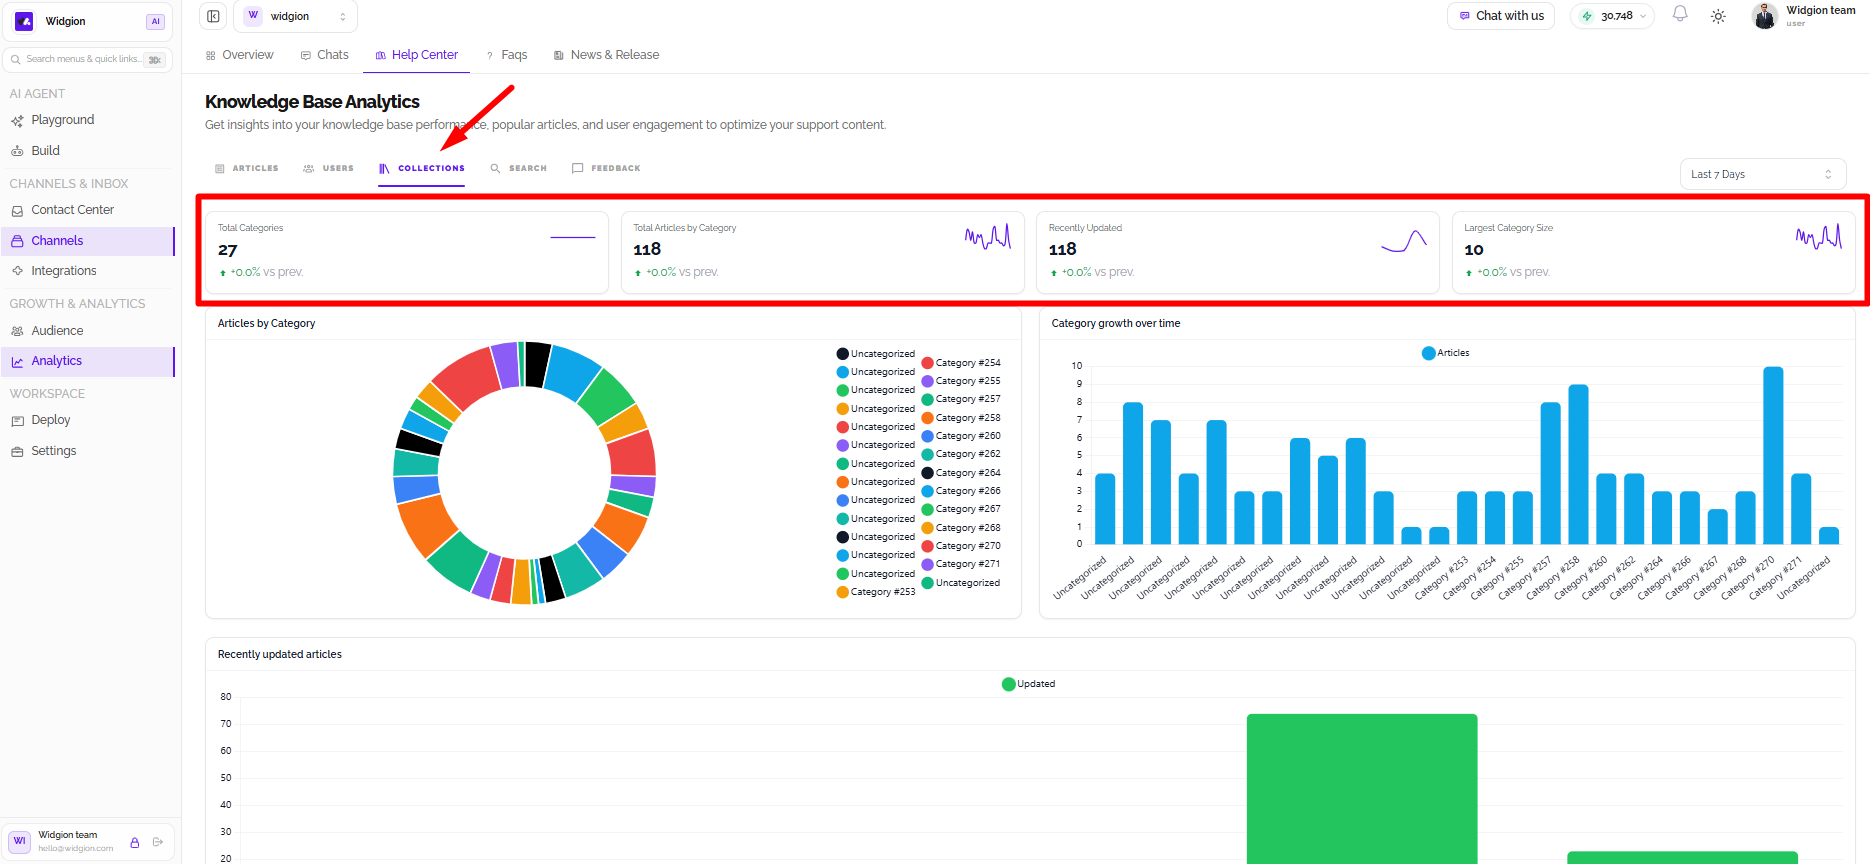
The Collections tab helps you understand how your Help Center articles are organized and how your collections change over time. The metric cards show Total Categories, Total Articles by Category, Recently Updated, and Largest Category Size.
The Articles by Category chart visualizes category distribution, while Category growth over time displays article counts across categories. The Recently updated articles chart provides a view of content updates over time.
Analyzing Help Center Searches
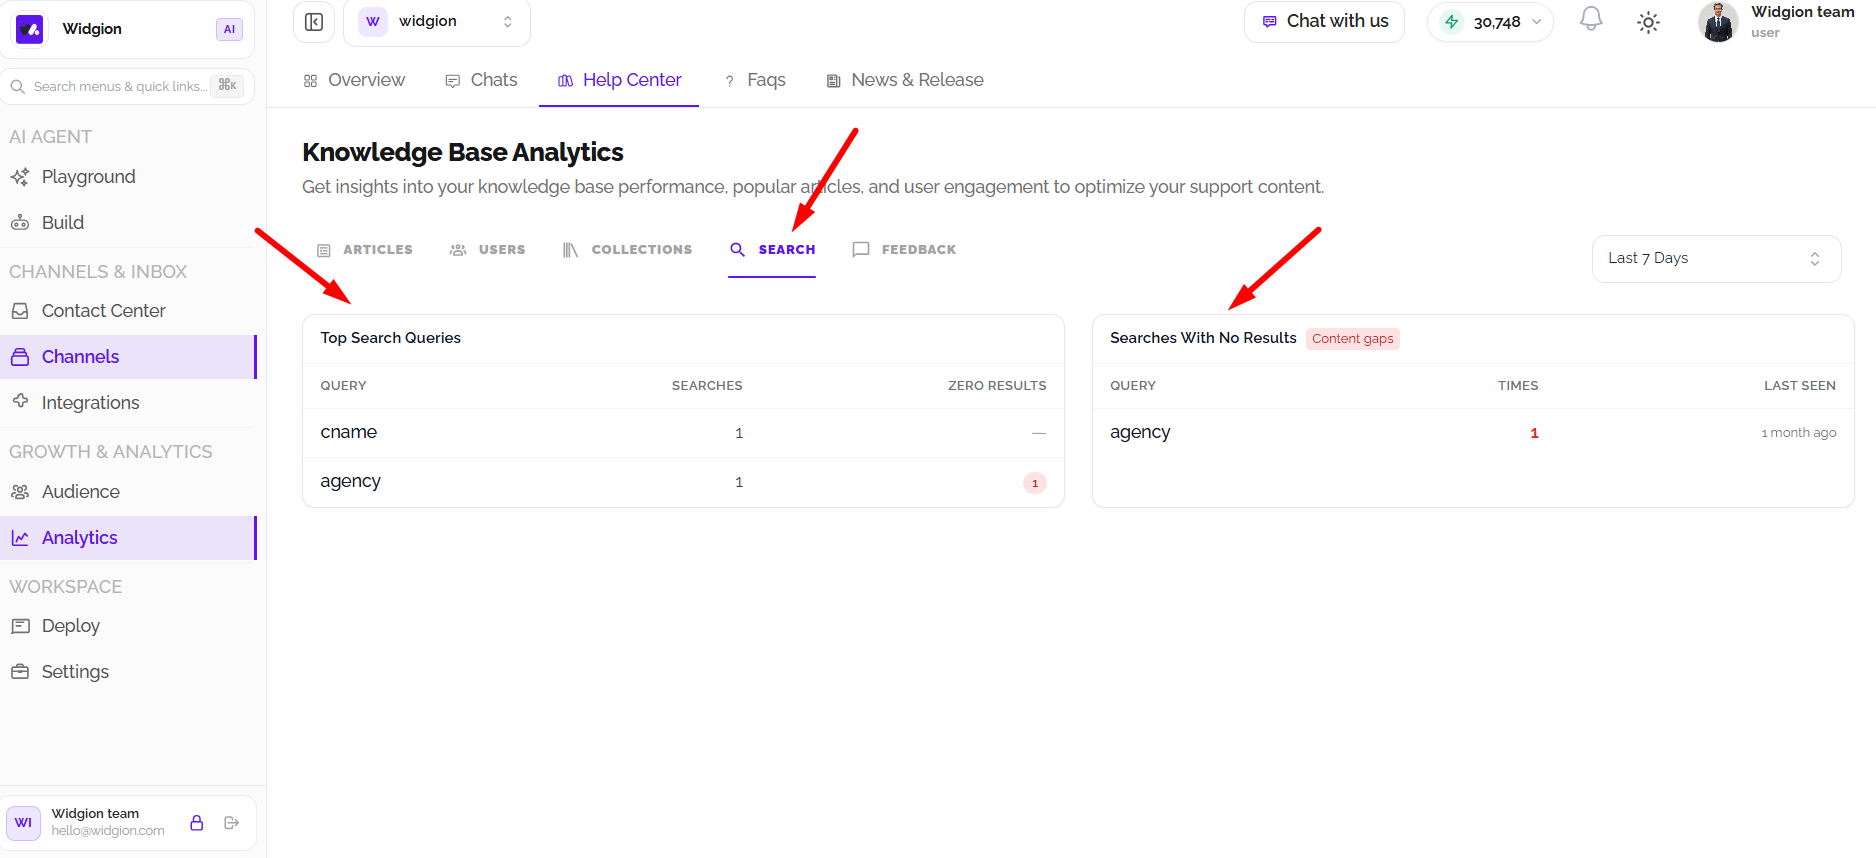
The Search tab reveals what visitors are searching for in your Help Center. The Top Search Queries table displays search terms, the number of searches, and how often each query returned zero results.
The Searches With No Results panel highlights queries that could indicate content gaps. Use this information to identify topics visitors are looking for but may not be finding in your existing articles.
Reviewing Article Feedback
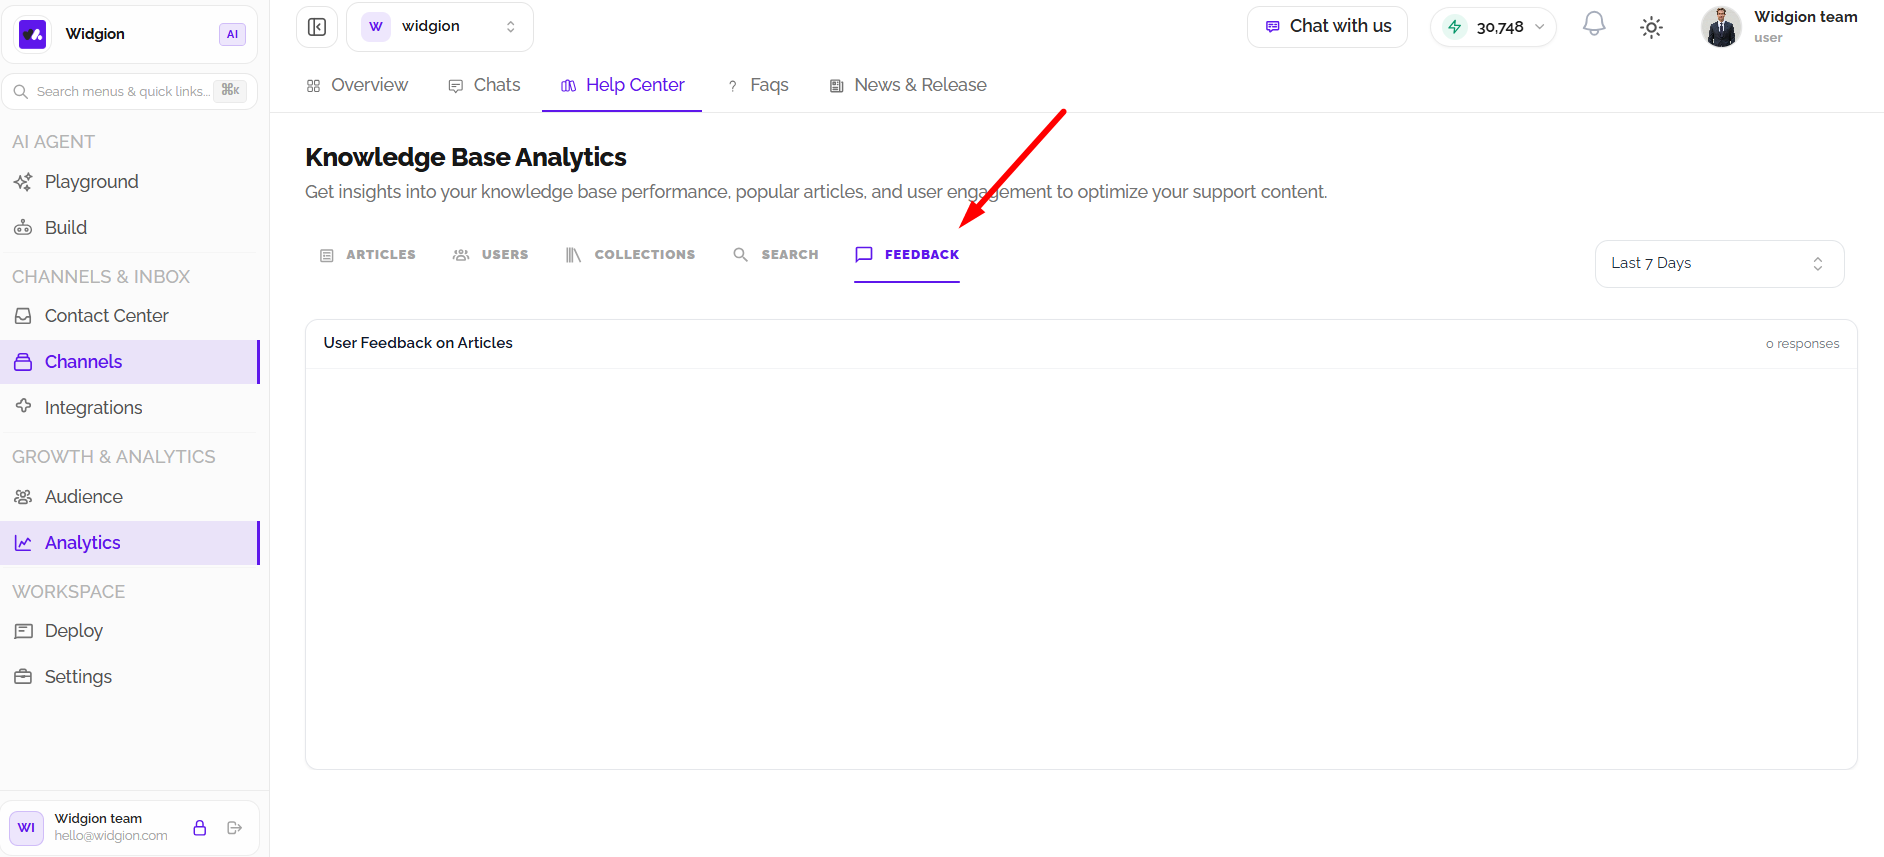
The Feedback tab displays the User Feedback on Articles panel, where article feedback activity is presented. This section helps you review feedback submitted by Help Center users. If feedback data is not available for the selected period, the panel may appear empty.
Filtering Analytics by Date
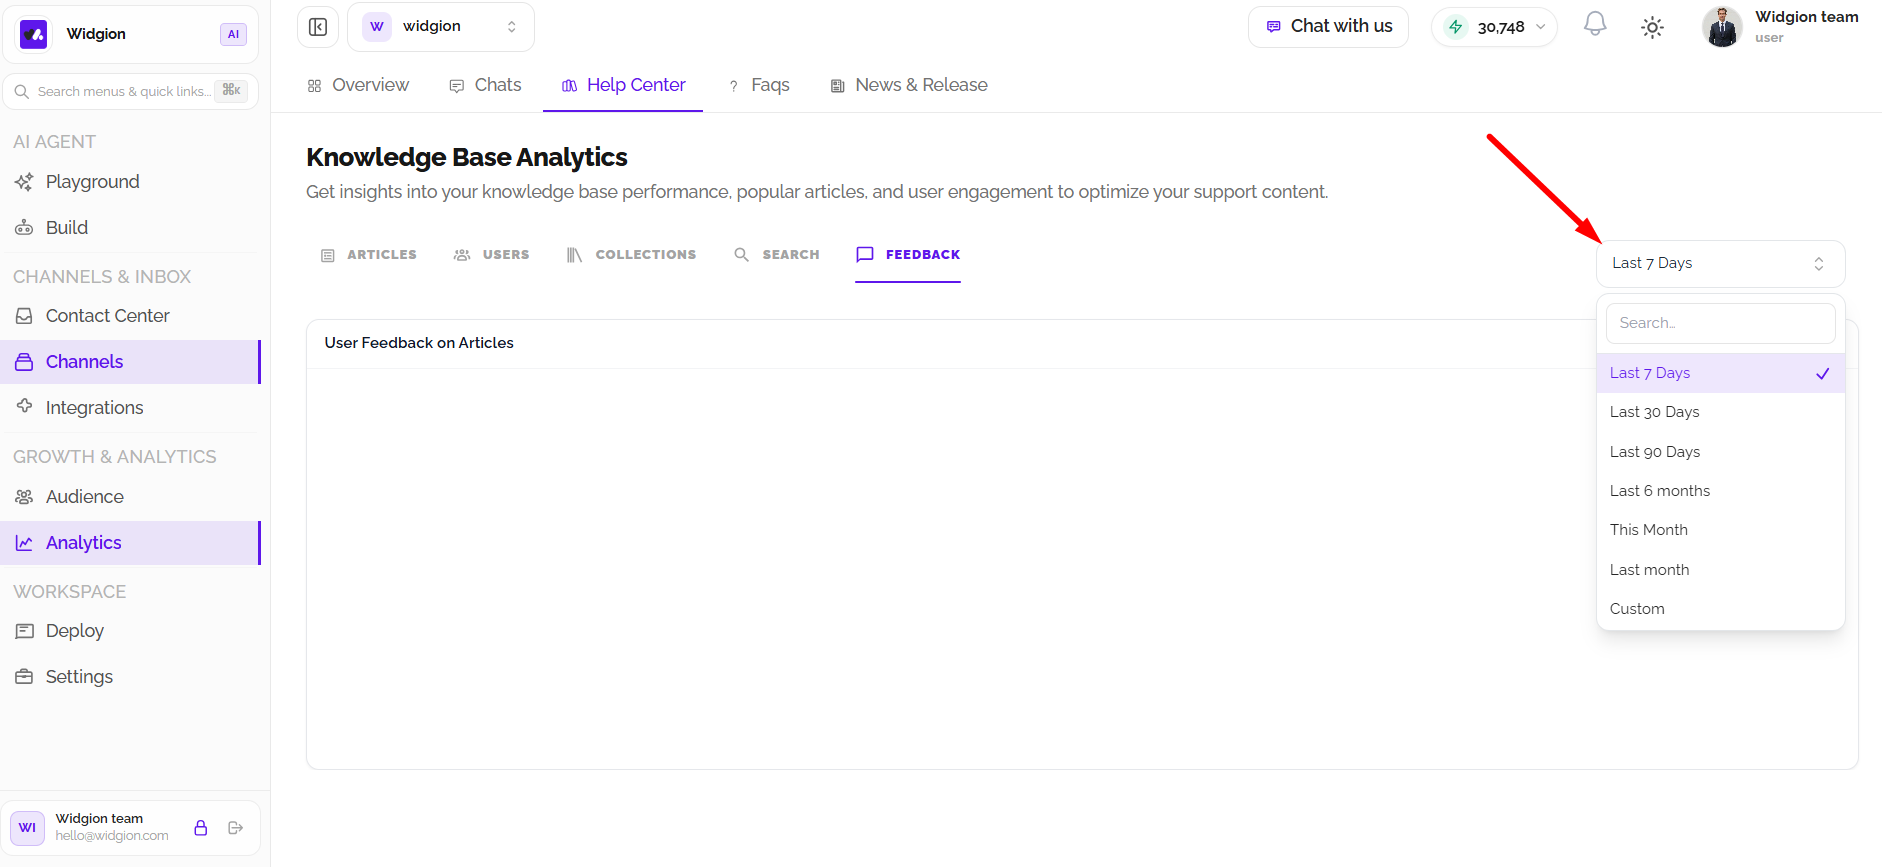
The date selector appears across the analytics sections and lets you choose the period used for reporting. Available options include Last 7 Days, Last 30 Days, Last 90 Days, Last 6 Months, This Month, Last Month, and Custom.
Choose a date range to review analytics for a particular period. The selected range helps you compare activity and understand how your knowledge base is performing over time.
Improving Your Help Center with Analytics
Use Knowledge Base Analytics to identify frequently viewed articles, review reader reactions, understand search queries, and monitor category organization. Search queries with no results can reveal content opportunities, while article feedback can help you identify areas that may need clarification or improvement.
Regularly reviewing these insights helps you keep your Help Center relevant, organized, and useful to visitors.
Did this answer your question?
What was missing or unclear?
Thank you for your feedback!
Your input helps us make this article better.
Still need help?
Contact support →Related articles
Exploring the Analytics Overview Dashboard
Learn how to navigate Widgion Analytics, understand the key performance metrics available in your workspace, and use analytics data to evaluate your AI assistant’s performance and customer interactions.
Understanding Chat Agent Analytics
Discover how to use Agent Analytics in Widgion to review your AI assistant’s activity, evaluate interaction performance, and identify opportunities to improve customer experiences.
Installing the Chat Widget on Your Website
Step-by-step guide to embedding the chat widget on your website.
Adding, Editing, and Managing Contact Data
Handles actions like adding contacts, editing details, deleting, and exporting.
On this page