
Understanding FAQ Analytics
Learn how to use FAQ Analytics to review the performance of frequently asked questions, understand how customers engage with FAQ content, and identify opportunities to improve self-service support.
FAQ Analytics helps you understand how visitors interact with your FAQ widget. It provides insights into searches, search effectiveness, user feedback, and engagement over time, helping you identify opportunities to improve your support content.
Accessing FAQ Analytics
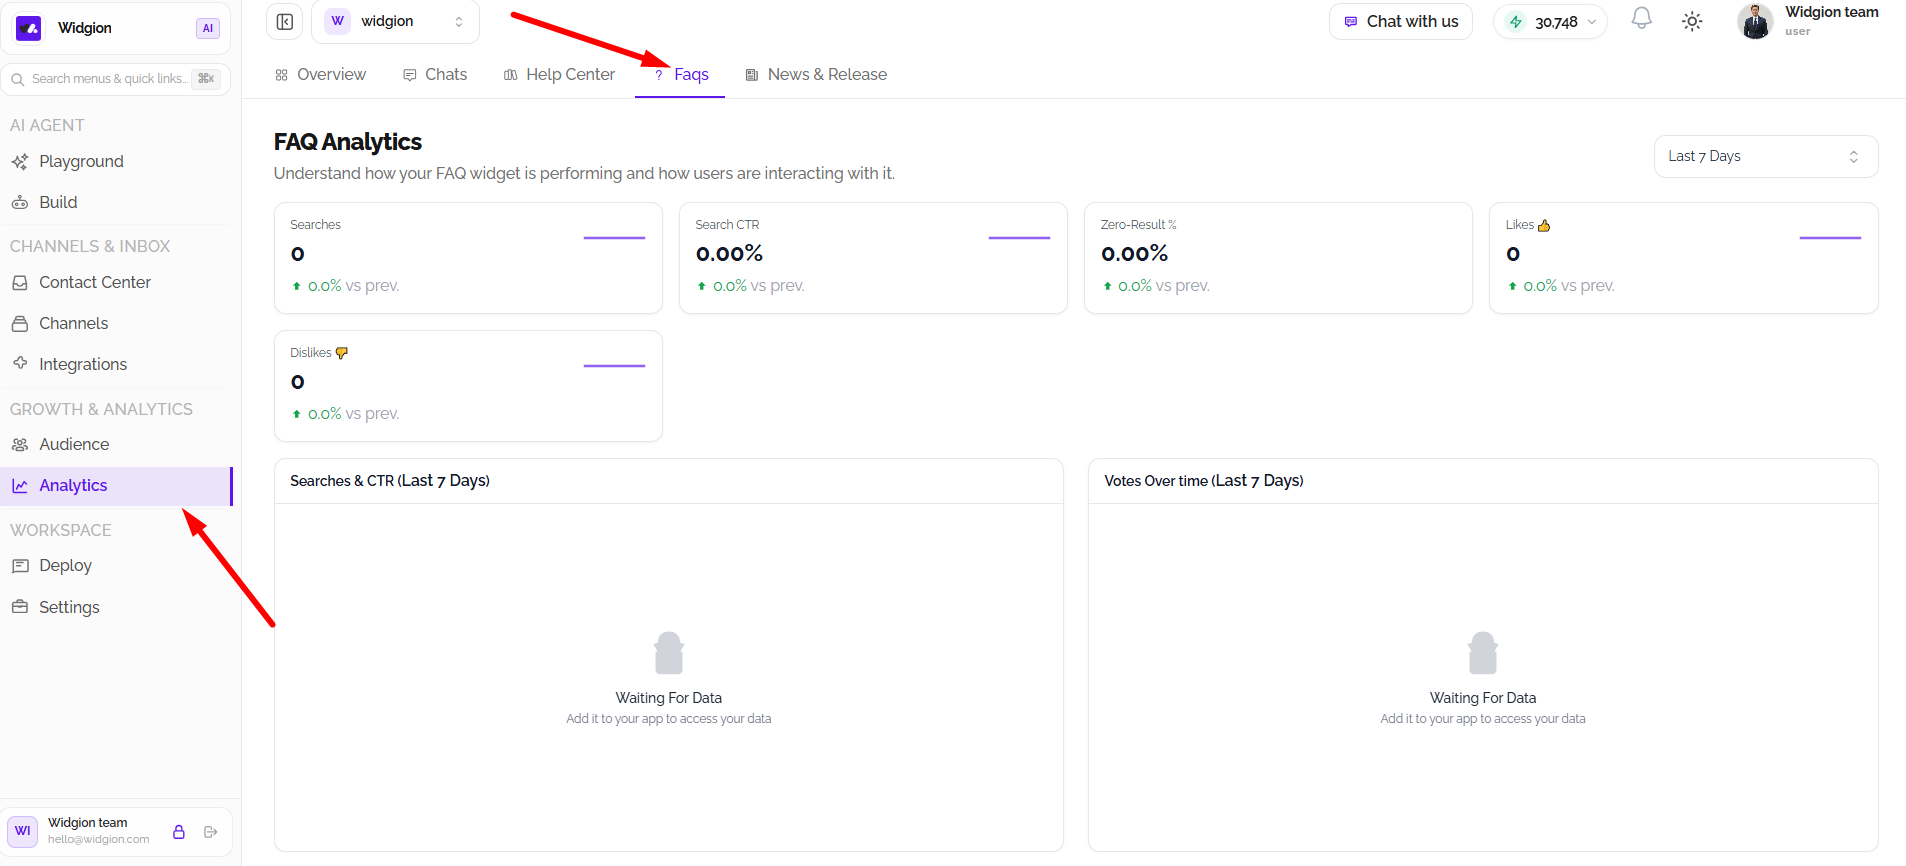
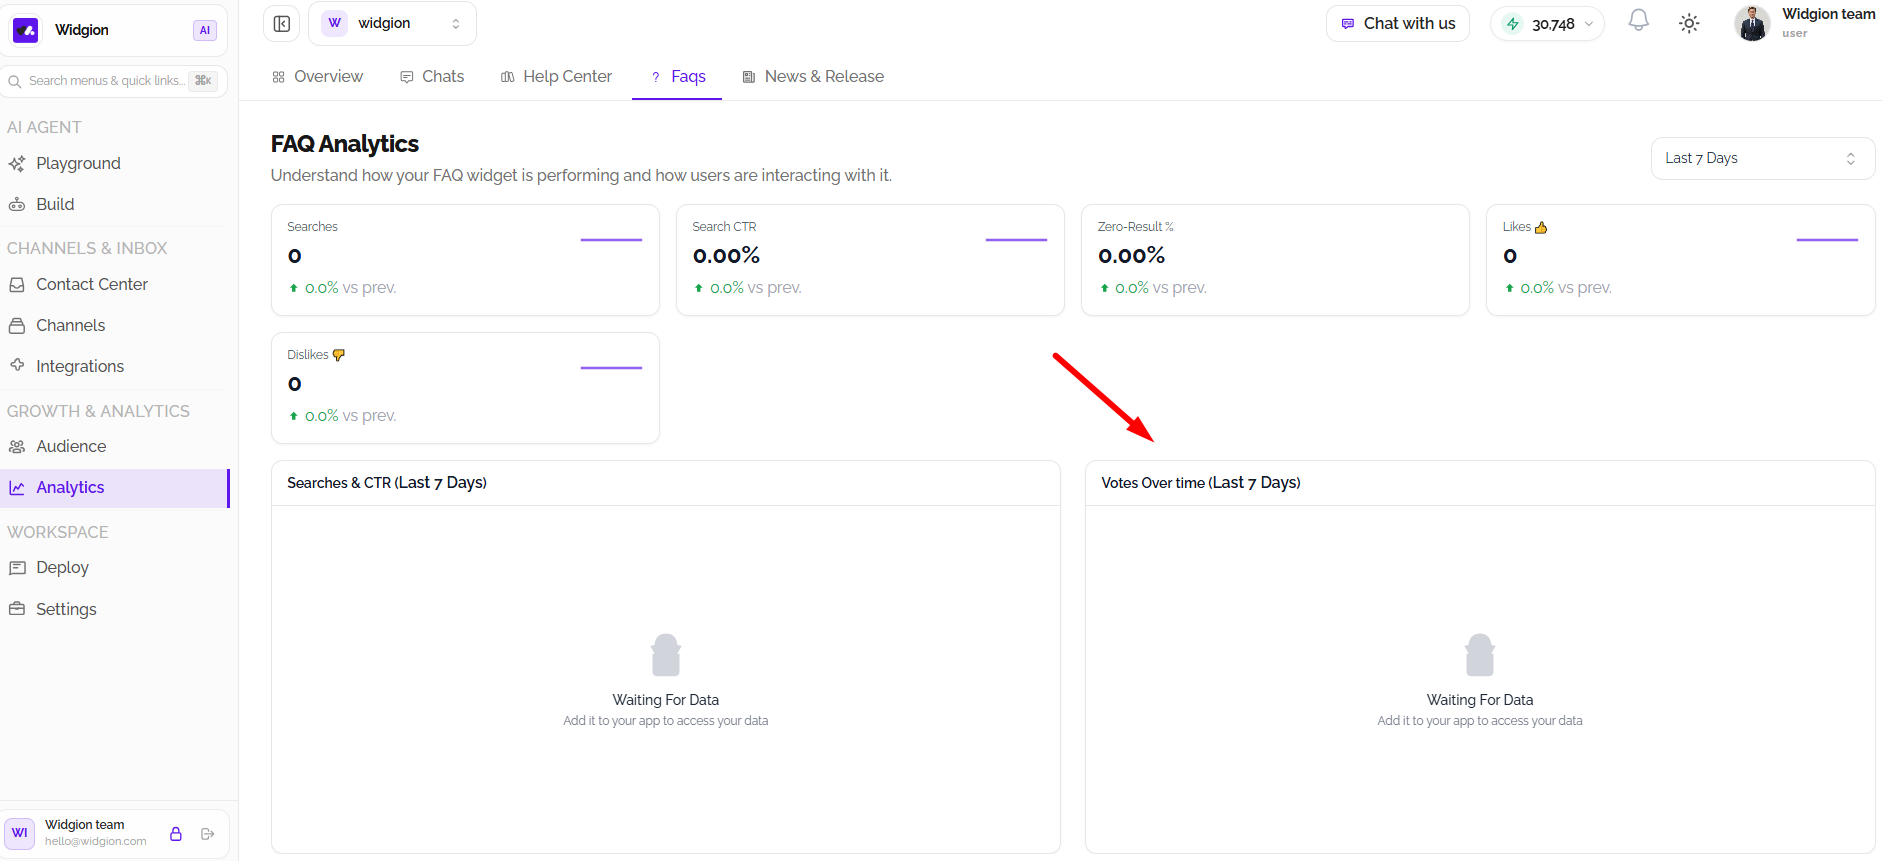
To access FAQ Analytics, open Analytics from the left-hand navigation menu. Select the FAQs tab from the top navigation. The dashboard displays metrics and charts related to your FAQ widget’s performance.
Selecting an Analytics Period
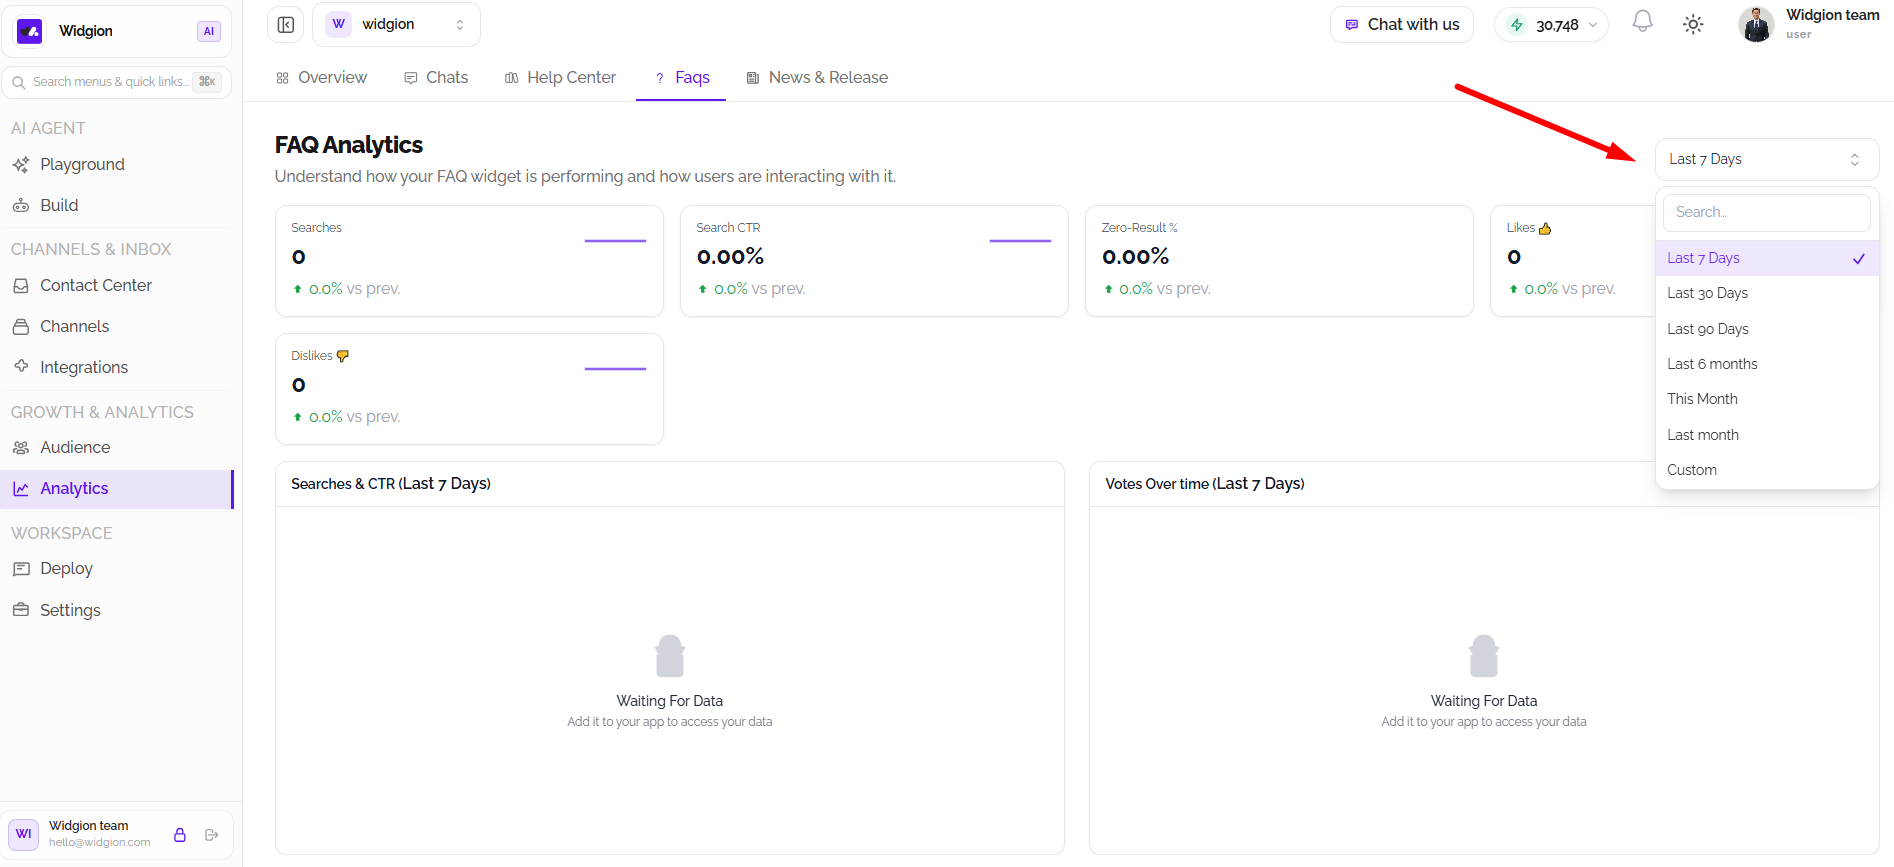
Use the date-range dropdown in the upper-right corner to choose the period you want to analyze. Available options include Last 7 Days, Last 30 Days, Last 90 Days, Last 6 Months, This Month, Last Month, and Custom.
Selecting a different period updates the dashboard metrics and charts to reflect the chosen timeframe.
Understanding FAQ Performance Metrics
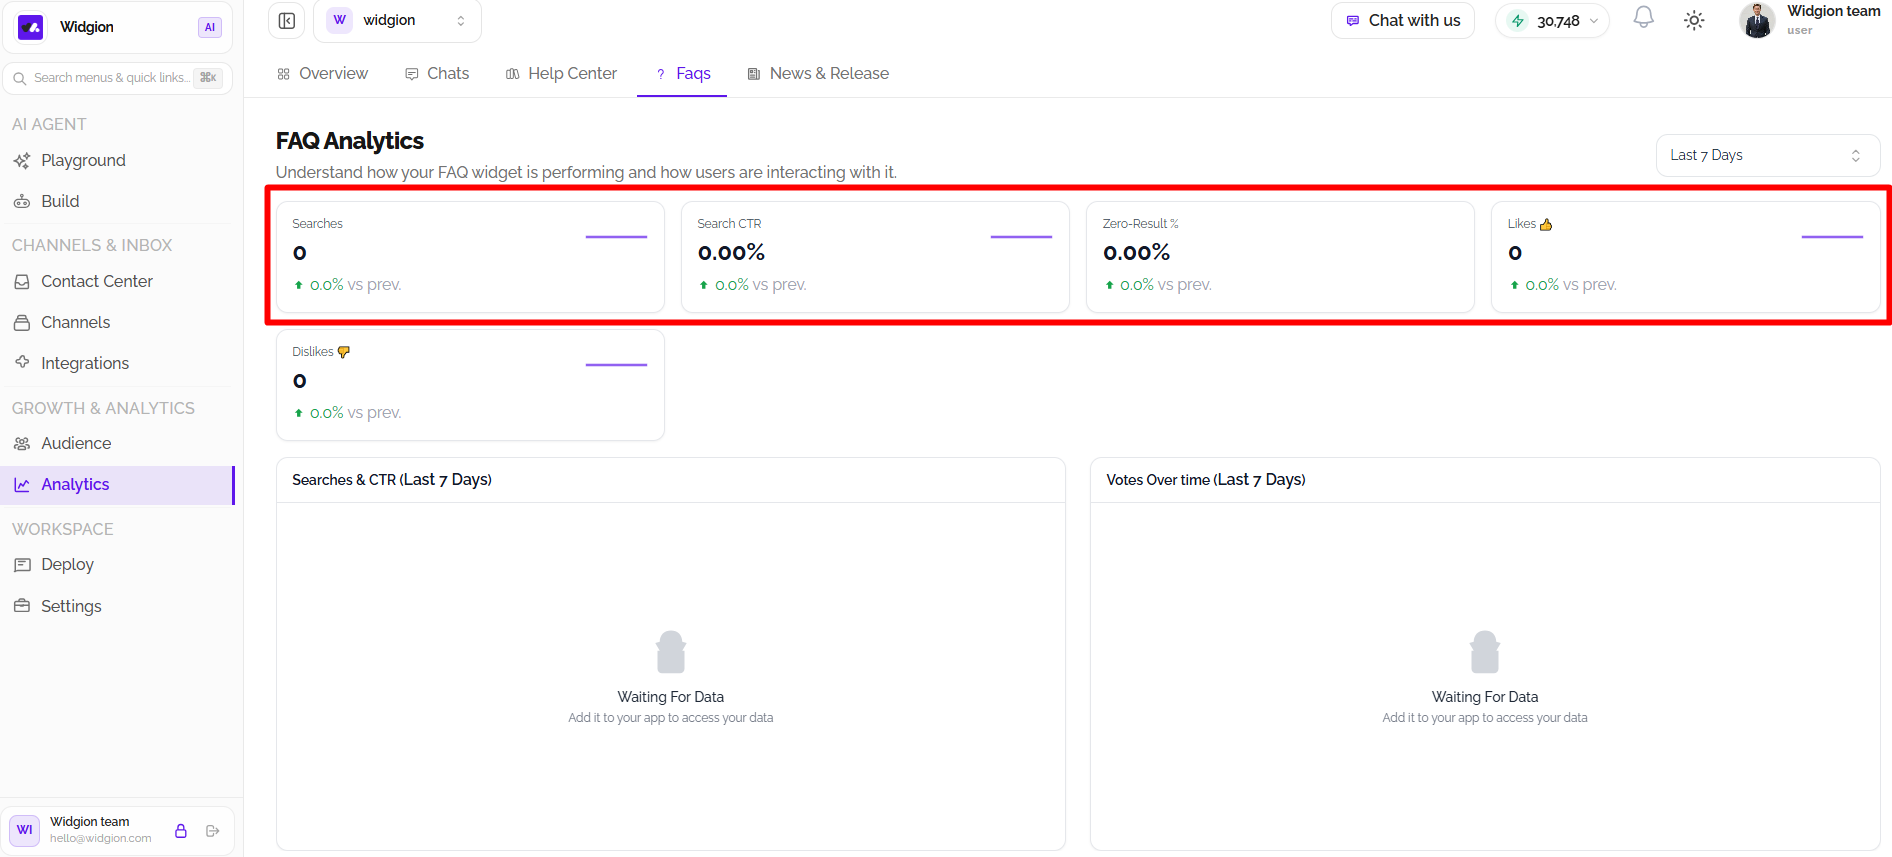
The dashboard displays key metrics that provide an overview of FAQ engagement. Searches shows the number of searches performed, while Search CTR indicates the click-through rate associated with searches. Zero-Result % shows the percentage of searches that returned no results.
The dashboard also displays Likes and Dislikes, helping you understand how users respond to your FAQ content. Each metric includes a comparison with the previous period.
Reviewing Searches and Search CTR
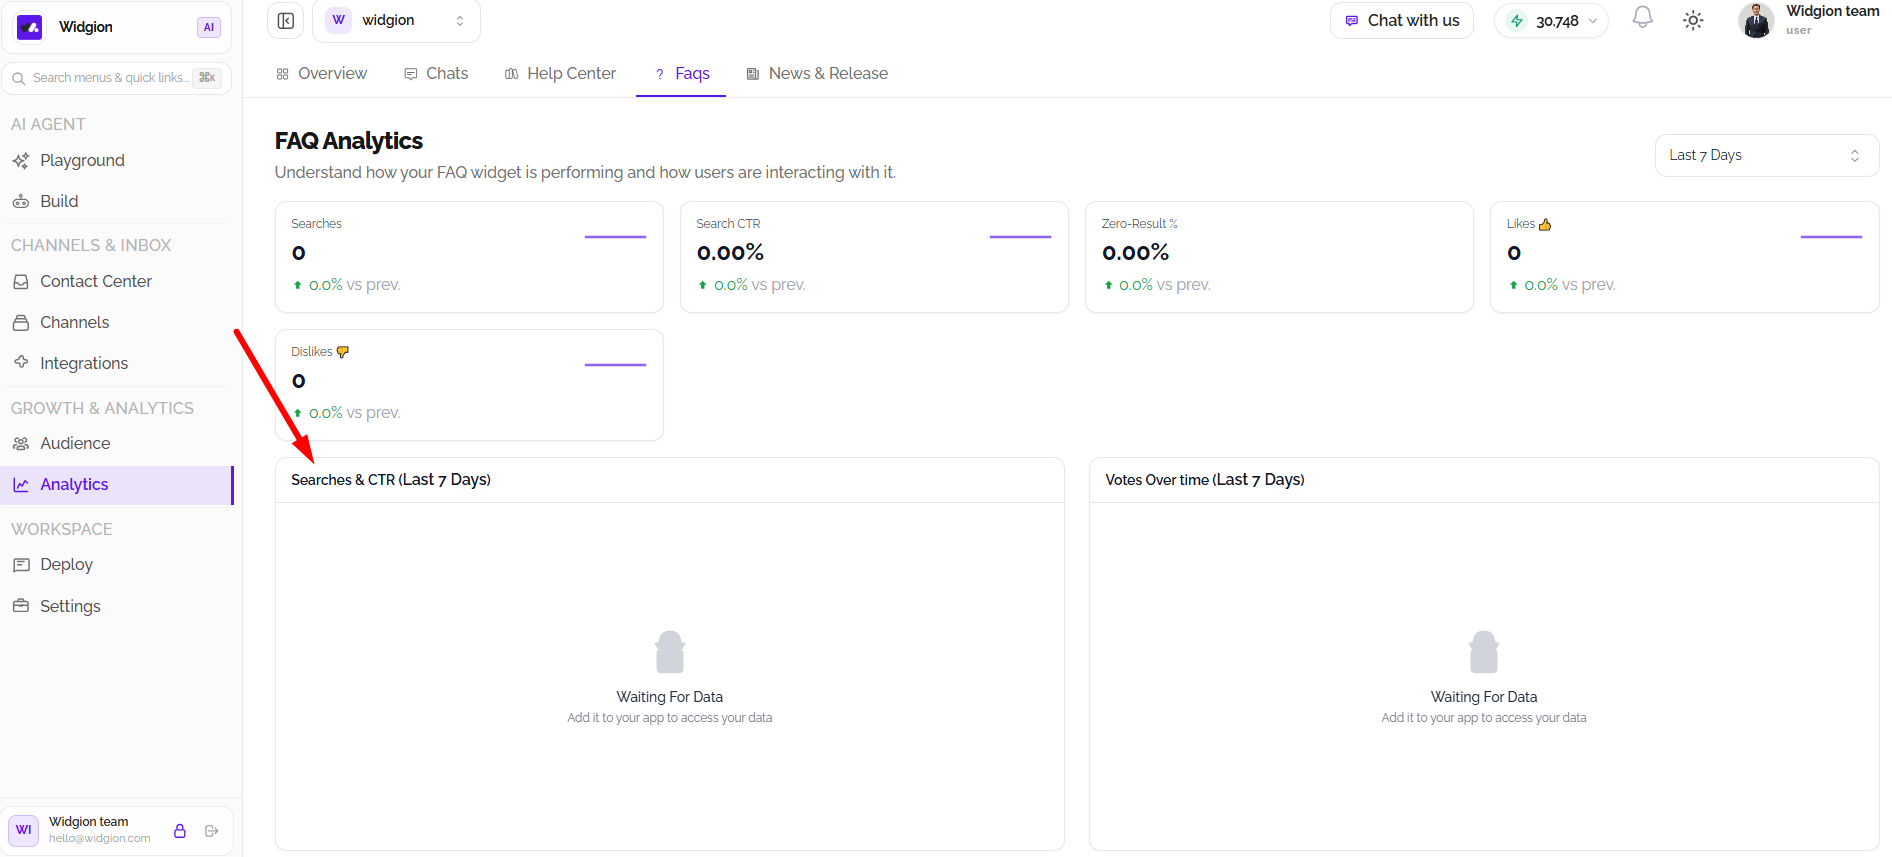
The Searches & CTR chart displays search activity and click-through performance over the selected period. Use this chart to review search trends and understand how effectively visitors engage with FAQ search results.
When data is unavailable, the chart displays a Waiting For Data message and indicates that the app needs to be added to access data.
Monitoring Votes Over Time
The Votes Over Time chart provides a view of FAQ feedback activity across the selected period. Use it to review how user votes change over time and assess feedback on your FAQ content.
If no feedback data is available for the selected period, the chart displays Waiting For Data.
Using FAQ Analytics to Improve Your Content
Review FAQ Analytics regularly to understand how users search for information, whether searches lead to useful results, and how visitors rate your content. Search activity, zero-result rates, and feedback can help highlight areas where your FAQ content may need attention.
Adjust the date range to compare different periods and evaluate how changes to your FAQ content affect engagement.
Did this answer your question?
What was missing or unclear?
Thank you for your feedback!
Your input helps us make this article better.
Still need help?
Contact support →Related articles
Exploring the Analytics Overview Dashboard
Learn how to navigate Widgion Analytics, understand the key performance metrics available in your workspace, and use analytics data to evaluate your AI assistant’s performance and customer interactions.
Understanding Chat Agent Analytics
Discover how to use Agent Analytics in Widgion to review your AI assistant’s activity, evaluate interaction performance, and identify opportunities to improve customer experiences.
Understanding Knowledge Base Analytics
Learn how to review Knowledge Base Analytics to understand how your knowledge sources support the AI assistant and identify opportunities to improve the information available to customers.
Installing the Chat Widget on Your Website
Step-by-step guide to embedding the chat widget on your website.
On this page